JHS3 Mathematics · Term 2, Week 9
Variables and Equations
Lesson notes
Learning Objectives
Indicator: B9.2.3.1.2
By the end of the lesson, learners can:
- State the meaning of solution sets for linear inequalities in one variable.
- Draw open and closed circles on a number line to correctly represent strict and inclusive inequalities.
- Graph the solution set of a given linear inequality on a number line, with the correct arrow direction.
- Solve a linear inequality and then illustrate its solution set on a number line.
- Interpret a number-line graph to write the corresponding inequality.
Sign in with your phone number to read the full note and download the GES plan - free.
Sign in with phone numberCurriculum details
- Strand
- Algebra (Strand 2)
- Sub-strand
- Variables and Equations (2.3)
- Content standard
- B9.2.3.1 - Demonstrate understanding of single variable linear inequalities with rational coefficients including: • solving inequalities • verifying • comparing • graphing
- Indicator
- B9.2.3.1.2 - Illustrate solution sets of linear inequalities on the number line
- Suggested placement
-
Term 2, Week 9
(Week 21 of the year)
Our suggestion, laid out in curriculum order across three terms of twelve weeks. NaCCA does not fix the week, so follow your school's scheme of learning.
- Curriculum reference
-
Mathematics, Common Core Programme (JHS1-JHS3), 2023, p. 190
Transcribed from the official NaCCA publication. Check this page against the source.
Exemplars (from the NaCCA curriculum)
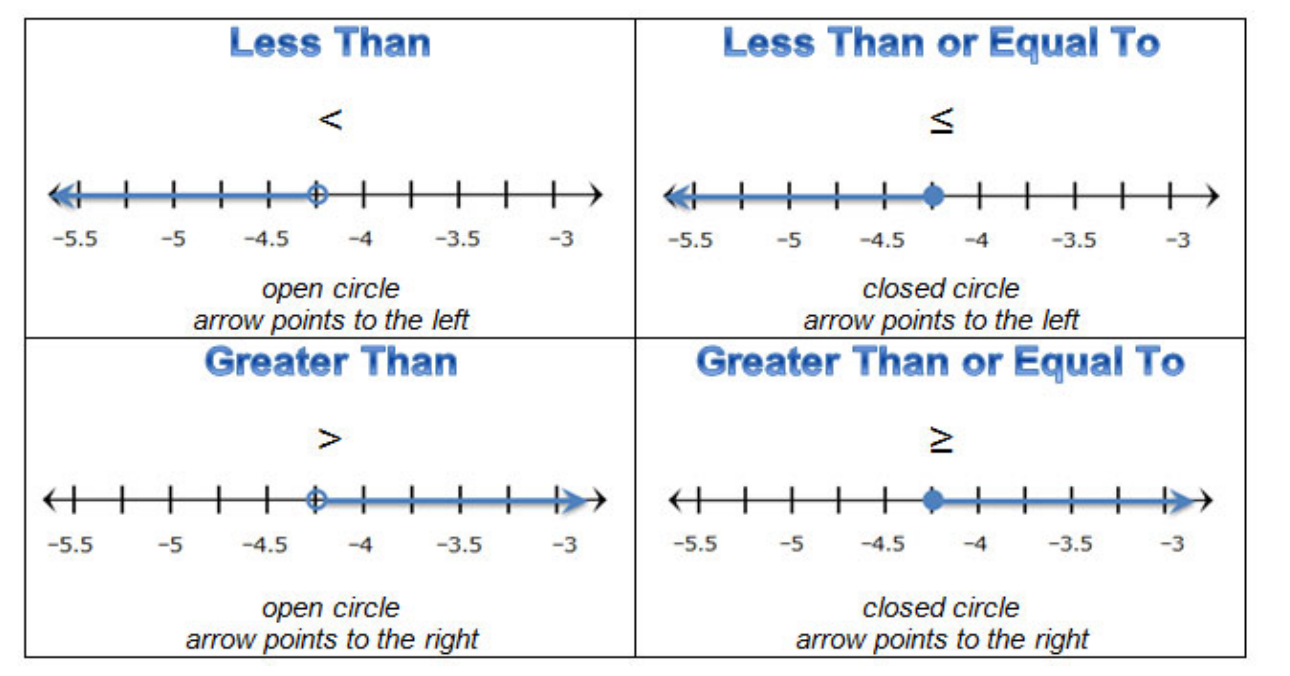
E.g.1 Illustrate and explain the inequality signs
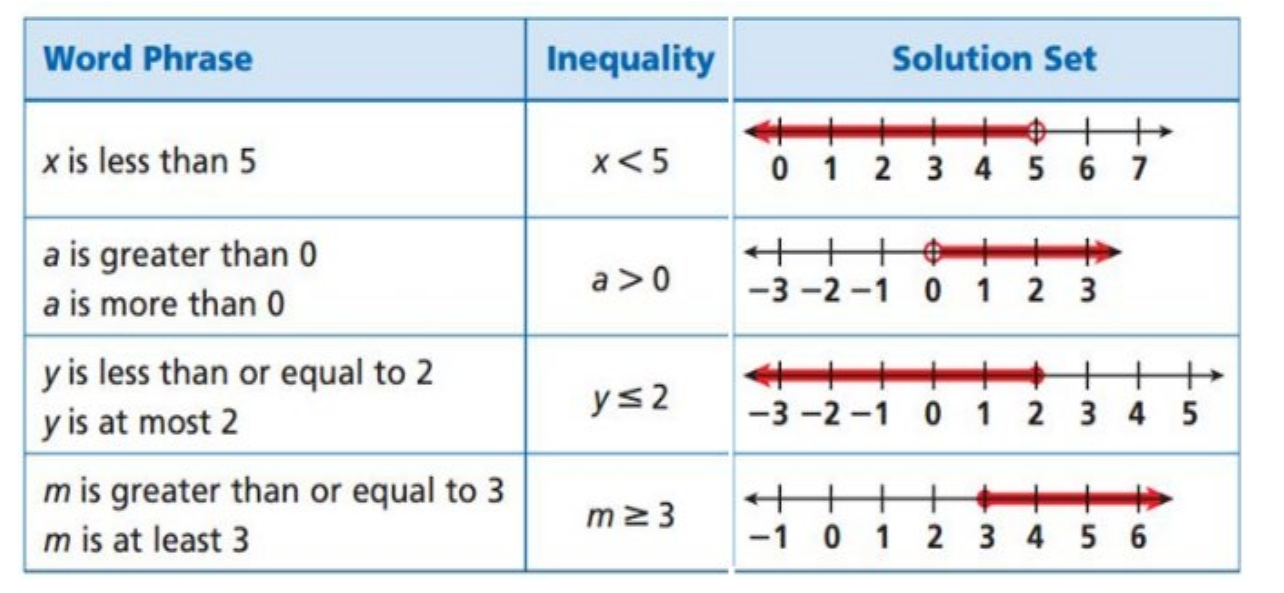
E.g.2 Graph linear inequalities in one variable on a number line.
E.g.3 Solve and graph linear inequalities on a number line.
i. -3x - 8 > -26 ii. 2x - 3 ≤ 19
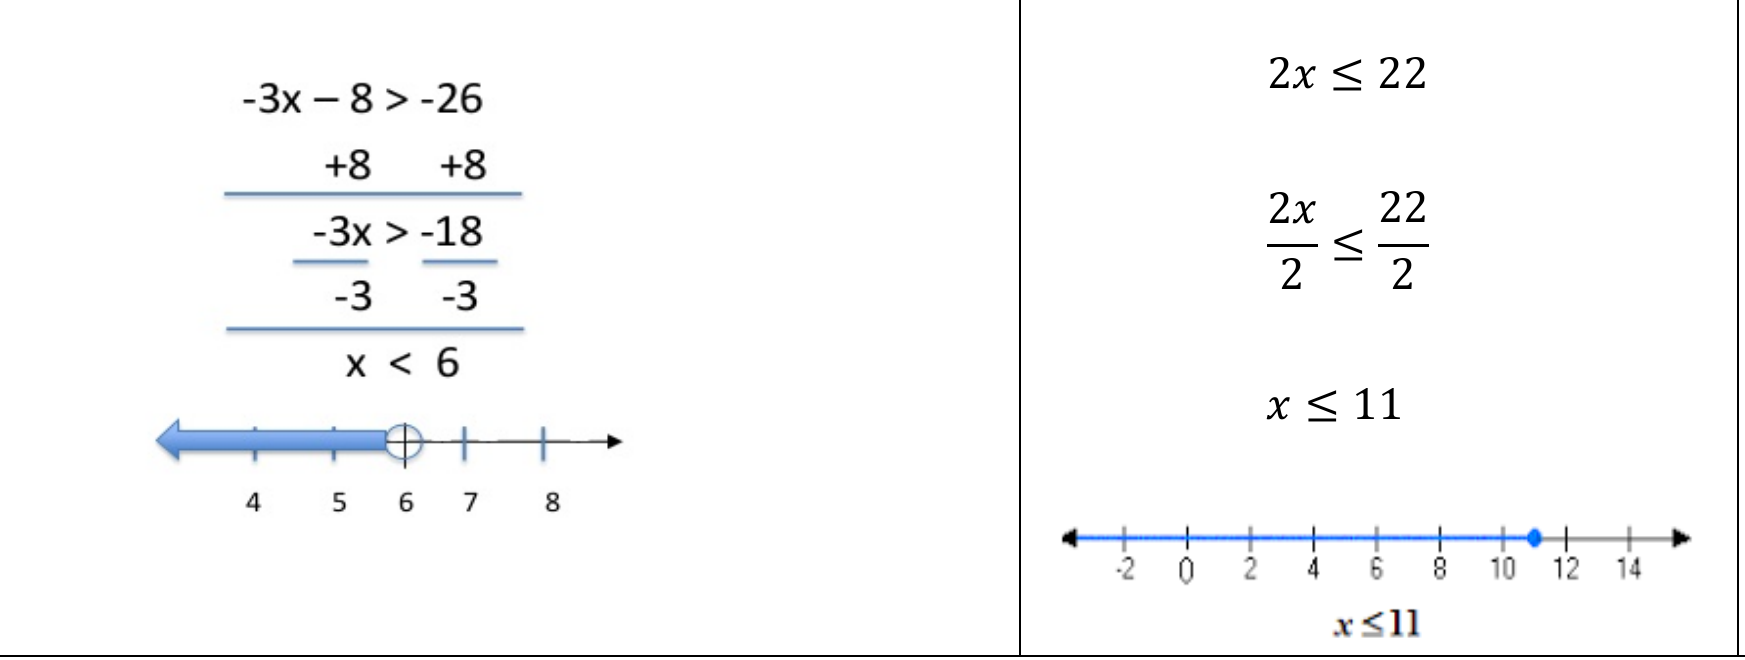
2x ≤ 22 2x 22 ≤
2 2 x ≤ 11
E.g.4 Solve and graph linear inequalities on a cartesian plane.
i. 2x ≥ 8 ii. 5y + 3 < 6 + iii. 7x <7 → 3× 7x < 2y 3 3
2x 8 7×3 ≥
2 2 5y - 2y < 6 - 3 7x 21 <
x ≥ 4 3y < 3 7 7 x < 3
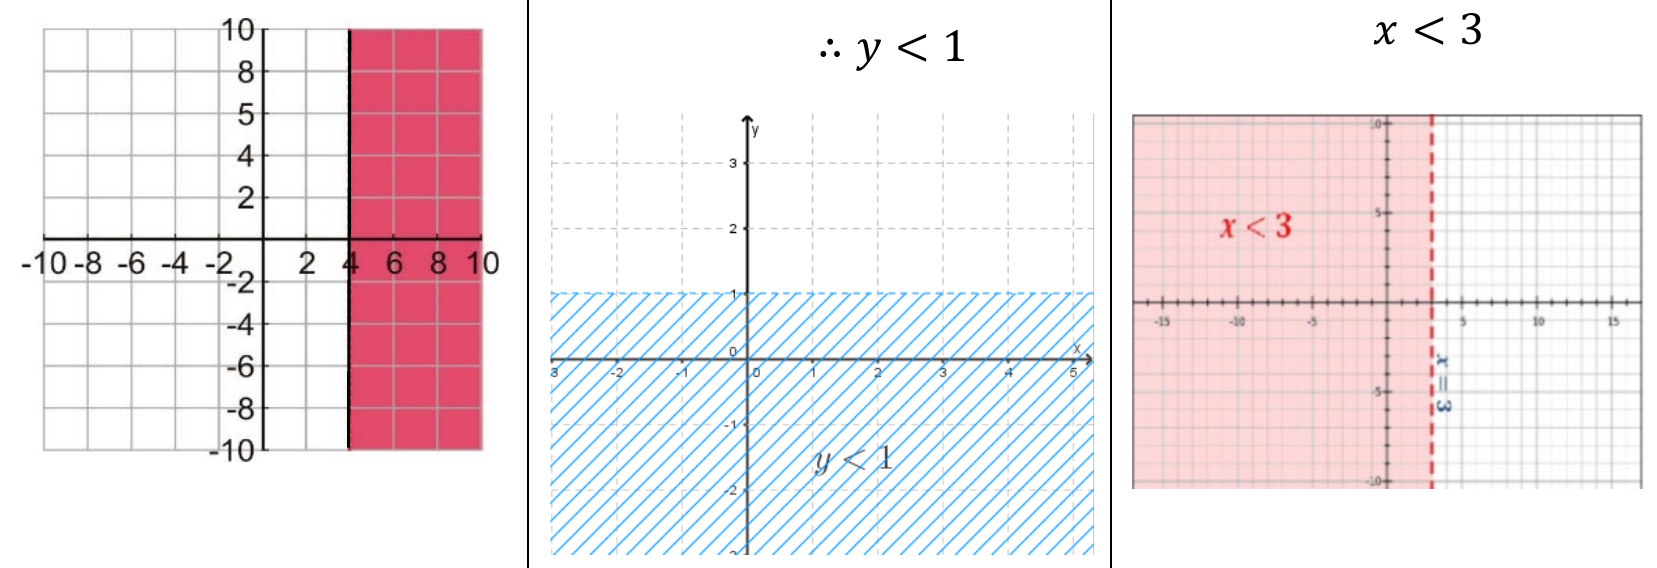
∴ y < 1