B4 Mathematics · Term 2, Week 8
Patterns and Relationships
Lesson notes
Learning Objectives
Indicator: B4.2.1.3.1 - Translate the information in a given problem into a table or chart
By the end of the lesson, learners can:
- Read a word problem and identify the information that can be organised into a table or chart.
- Construct a table or chart with clear headings to organise the data from a given problem.
- Translate numerical patterns and relationships from word problems into accurate table entries.
- Explain how the table or chart helps to make the information in the problem clearer and easier to use.
- Complete a partially filled table or chart that has been created from a word problem.
Sign in with your phone number to read the full note and download the GES plan - free.
Sign in with phone numberCurriculum details
- Strand
- Algebra (Strand 2)
- Sub-strand
- Patterns and Relationships (2.1)
- Content standard
- B4.2.1.3 - Represent, describe and extend patterns and relationships, using charts and tables, to solve problems
- Indicator
- B4.2.1.3.1 - Translate the information in a given problem into a table or char
- Suggested placement
-
Term 2, Week 8
(Week 20 of the year)
Our suggestion, laid out in curriculum order across three terms of twelve weeks. NaCCA does not fix the week, so follow your school's scheme of learning.
- Source document note
-
The official curriculum document has a fault in this entry, so the curriculum text above is transcribed exactly as printed:
- exemplars - p.32
- Curriculum reference
-
Mathematics Curriculum for Primary Schools (Basic 4-6), 2019, p. 32
Transcribed from the official NaCCA publication. Check this page against the source.
Exemplars (from the NaCCA curriculum)
E.g. 1. Given the numerical pattern, ask students to extend the pattern and explain how they determined the pattern and its missing elements
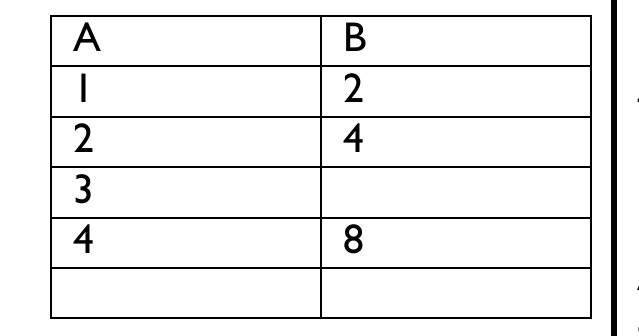
E.g. 2. Ask students to use manipulatives to represent this pattern and describe the relationship between the chart and the concrete representations The A/B table (1-2, 2-4, 3-blank, 4-8) is set beside E.g. 1 and its cells interleave with the exemplar and with the indicator heading in the text layer; the figure shows it.