SHS1 Mathematics · Semester 1, Week 16
Patterns and Relations
Lesson notes
Learning Objectives
Indicator: 1.2.2.LI.2 - Draw graphs of linear functions and interpret them.
By the end of the lesson, learners can:
- Identify whether a given equation in two variables represents a linear function without plotting values, and justify their reasoning.
- Draw the graph of a linear function in the form y = mx + c by constructing a table of values and plotting points.
- Explain the effect of changing the value of c (the y-intercept) on the position of a straight-line graph.
- Explain the effect of changing the value of m (the gradient) on the steepness and direction of a straight-line graph.
- Interpret a straight-line graph drawn over a given interval, including reading coordinates of points, the y-intercept, and the gradient.
Sign in with your phone number to read the full note and download the GES plan - free.
Sign in with phone numberCurriculum details
- Strand
- Algebraic Reasoning (Strand 2)
- Sub-strand
- Patterns and Relations (2.2)
- Content standard
- 1.2.2.CS.1 - Demonstrate an understanding of mapping, relations, and functions and the ability to interpret graphs of a function and its applications in real life. 1.2.2.LO.1 Distinguish between relations and functions, determine the rules, then draw graphs of functions and interpret them.
- Indicator
- 1.2.2.LI.2 - Draw graphs of linear functions and interpret them.
- Suggested placement
-
Semester 1, Week 16
(Week 16 of the year)
Our suggestion, laid out in curriculum order across three terms of twelve weeks. NaCCA does not fix the week, so follow your school's scheme of learning.
- Source document note
-
The official curriculum document has a fault in this entry, so the curriculum text above is transcribed exactly as printed:
- exemplars - p.76: the equation text on this page is set in a CambriaMath subset whose /ToUnicode map doubles every letter and gets many of them wrong, and the glyph ids could not be lined up with the extraction to repair it, so any italic variable here may be doubled or be the wrong letter; read the page
- Curriculum reference
- NaCCA curriculum document, p. 76
Exemplars (from the NaCCA curriculum)
Initiating Talk for Learning in a whole class discussion, review the form of a linear function as y = mx + c where m and c are constant (include the form ax + by + c = 0).
Experiential Learning: In small groups, learners use any of the available IT tools to research and come out with an explanation as to why the graph of a linear function is a straight line.
Example: Mrs. Avotris asks Ama to identify whether the given equation 3𝑥 − 7𝑦 = 16 forms a linear graph without plotting its values.
Solution: First, Ama needs to identify the type of equation. Next, she needs to remember that any linear equation in two variables always represents a straight line. Therefore, the above equation represents a straight line.
Collaborative learning: In pairs, task learners to draw a straight line given a gradient and justify their answer.
Example: Draw the graph of a straight line with the following gradient and explain your answer. i. 1 ii. -1
Solution i.
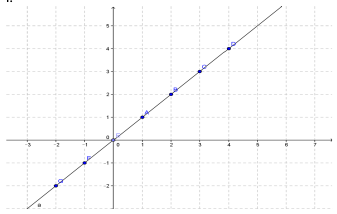
The graph with the gradient 1 passes through the origin. ii.
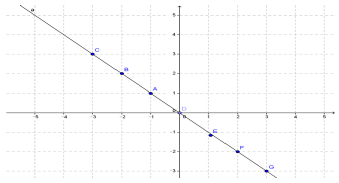
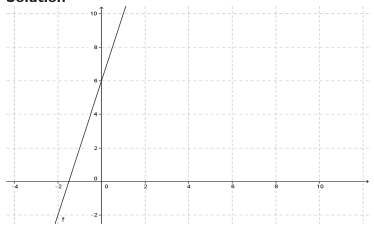
Collaborative Learning: In pairs, task learners to brainstorm on how to draw a straight line using the slope-intercept form (I.e., 𝑦𝑦 = 𝑚𝑚𝑚𝑚 + 𝑐𝑐 ) and investigate what happens if the constant 𝑐𝑐 (i.e., yintercept) keeps on changing in a particular equation.
Example: Draw the graph of 𝑦 = 4𝑥 + 6 and explain what happens if the constant 6 is changed to 1.
Solution
Collaborative Learning: In pairs, task learners to brainstorm on how to draw a straight line, using equations in the form 𝑦 = 𝑚𝑥 + 𝑐 and investigate what happens if the coefficient of 𝑥 keeps on changing in a particular equation.
Example: Draw the graph of 𝑦 = 4𝑥 + 6 and explain what happens if the coefficient 4 is changed to 2,1, 0 and -1, respectively.
Solution: As the co-efficient decreases, the line is rotated clockwise about (0, 6)
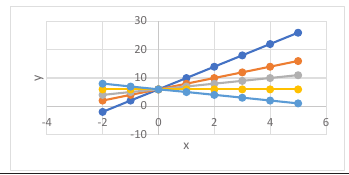
Talk for Learning: In a whole class discussion, review how to draw a linear function with a given interval.
Teaching and Learning Resources:
- * GeoGebra * Algebraic tiles * Graph boards
- * Patterns * Calculator
- * Technology tools such as * * Computer
- Mobile phone
- YouTube videos, etc.
Assessment (1.2.2.AS.2). The document marks these depth-of-knowledge levels for this indicator: Level 3 Strategic reasoning; Level 4 Extended critical thinking and reasoning.