JHS3 Mathematics · Term 2, Week 3
Patterns and Relations
Lesson notes
Learning Objectives
Indicator: B9.2.1.1.1 - Construct a table of values for two linear relations and graph the relation
By the end of the lesson, learners can:
- Construct a table of values for two linear relations given in the form y = mx + c for integer values of x.
- Construct a table of values for two linear relations given in the form ax + by = c by first rearranging the equation to make y the subject.
- Plot the points from a table of values on a Cartesian plane and draw the straight-line graph for each relation.
- Label each graph with its corresponding equation and identify the point where the two lines cross.
- Communicate their findings in small groups, explaining clearly how they completed each table and drew each graph.
Sign in with your phone number to read the full note and download the GES plan - free.
Sign in with phone numberCurriculum details
- Strand
- Algebra (Strand 2)
- Sub-strand
- Patterns and Relations (2.1)
- Content standard
- B9.2.1.1 - Demonstrate the ability to construct tables of values for pairs of linear relations, graph the relations in a number plane and determine the intersection of the lines to solve simultaneous linear equations.
- Indicator
- B9.2.1.1.1 - Construct a table of values for two linear relations and graph the relation
- Suggested placement
-
Term 2, Week 3
(Week 15 of the year)
Our suggestion, laid out in curriculum order across three terms of twelve weeks. NaCCA does not fix the week, so follow your school's scheme of learning.
- Curriculum reference
-
Mathematics, Common Core Programme (JHS1-JHS3), 2023, p. 180
Transcribed from the official NaCCA publication. Check this page against the source.
Exemplars (from the NaCCA curriculum)
E.g.1Construct a table of values for two linear E.g.2 Draw graph for two linear relations and draw the graphs of the relations. relations
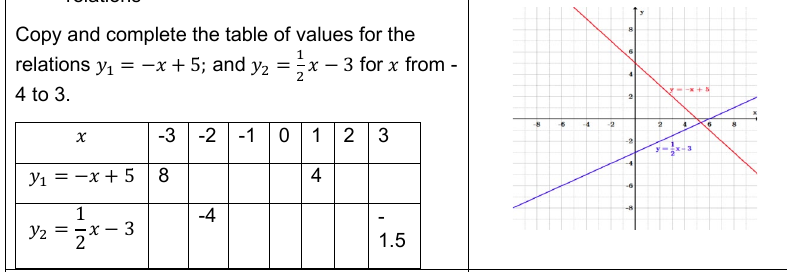
Copy and complete the table of values for the relations y = -x + 5; and y = 1 x - 3 for x from -
1 2 2
4 to 3. x -3 -2 -1 0 1 2 3
y = -x + 5 8 4 1
1 -4 -
y = x - 3
2 2 1.5
E.g.3Construct a table of values for two linear E.g.4 Draw a graph for two linear relations. relations.
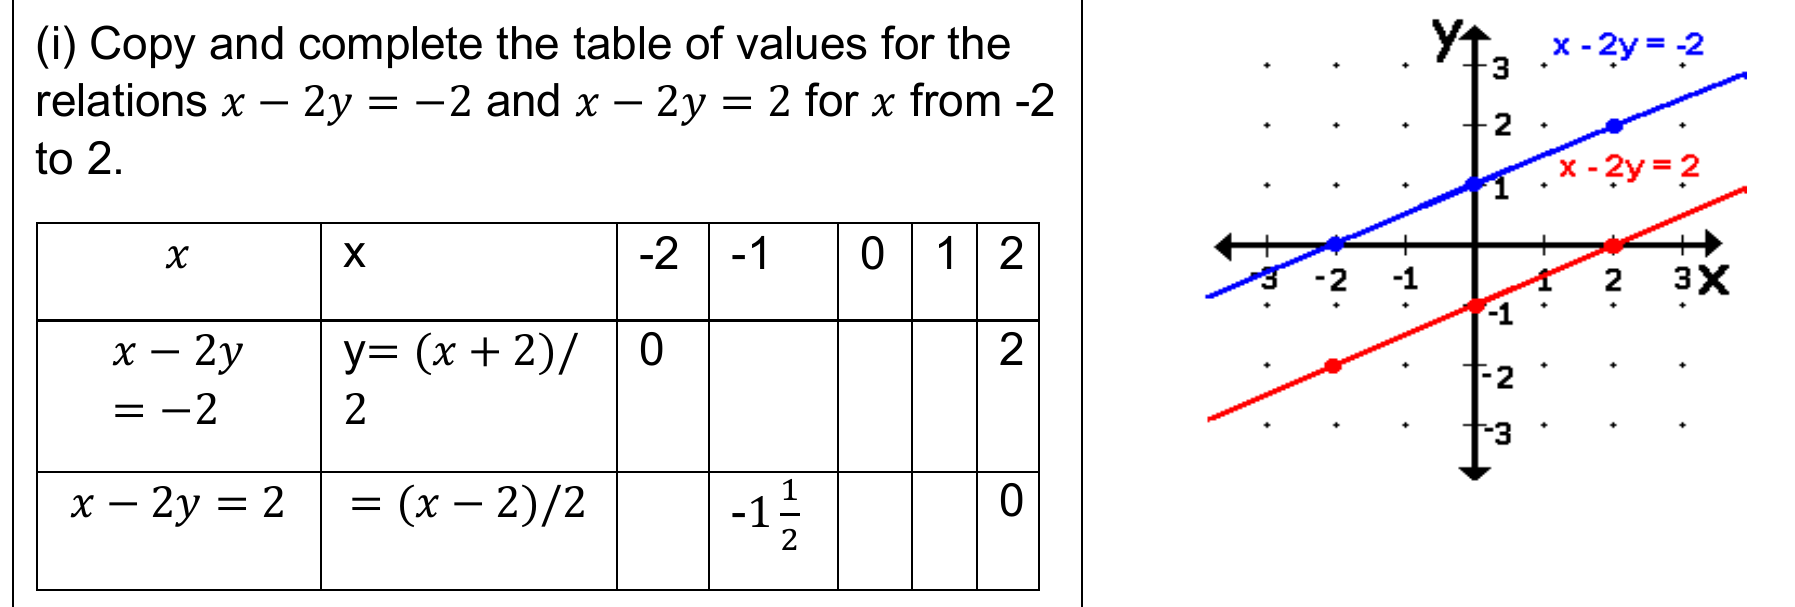
(i) Copy and complete the table of values for the relations x - 2y = -2 and x - 2y = 2 for x from -2 to 2. x x -2 -1 0 1 2
x - 2y y= (x + 2)/ 0 2 = -2 2
x - 2y = 2 = (x - 2)/2 -1 1 0 2