JHS3 Mathematics · Term 2, Week 4
Patterns and Relations
Lesson notes
Learning Objectives
Indicator: B9.2.1.1.3 - Use graphs to solve equations involving two linear relations.
By the end of the lesson, learners can:
- Plot two linear relations on the same number plane using a table of values
- Identify the point of intersection of two graphed lines as the solution to a pair of simultaneous linear equations
- Read the coordinates of the intersection point accurately from a graph
- Verify a solution by substituting the intersection coordinates into both original equations
- Solve word problems involving two linear relations by drawing graphs and finding their intersection
Sign in with your phone number to read the full note and download the GES plan - free.
Sign in with phone numberCurriculum details
- Strand
- Algebra (Strand 2)
- Sub-strand
- Patterns and Relations (2.1)
- Content standard
- B9.2.1.1 - Demonstrate the ability to construct tables of values for pairs of linear relations, graph the relations in a number plane and determine the intersection of the lines to solve simultaneous linear equations.
- Indicator
- B9.2.1.1.3 - Use graphs to solve equations involving two linear relations.
- Suggested placement
-
Term 2, Week 4
(Week 16 of the year)
Our suggestion, laid out in curriculum order across three terms of twelve weeks. NaCCA does not fix the week, so follow your school's scheme of learning.
- Curriculum reference
-
Mathematics, Common Core Programme (JHS1-JHS3), 2023, p. 182
Transcribed from the official NaCCA publication. Check this page against the source.
Exemplars (from the NaCCA curriculum)
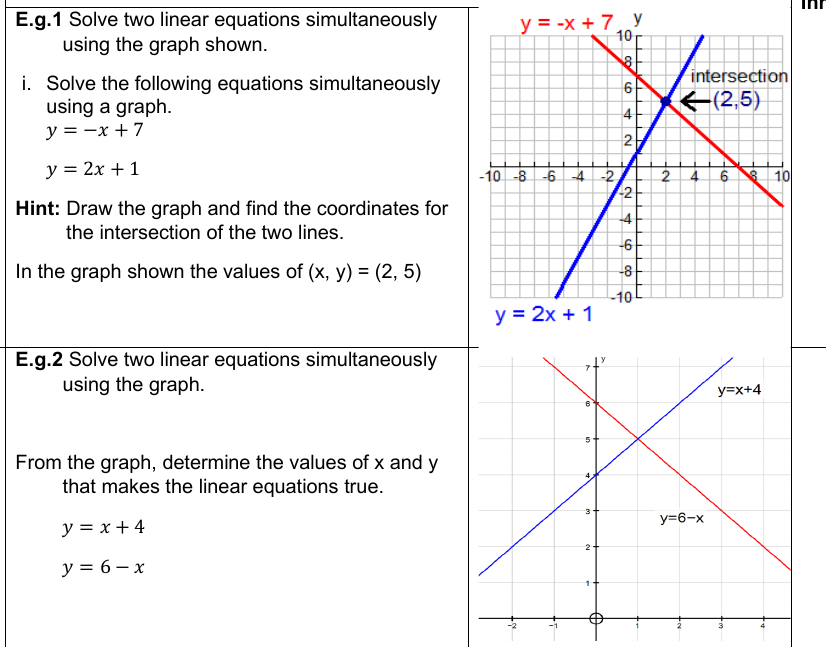
E.g.1 Solve two linear equations simultaneously using the graph shown.
i. Solve the following equations simultaneously using a graph. y = -x + 7 y = 2x + 1
Hint: Draw the graph and find the coordinates for the intersection of the two lines.
In the graph shown the values of (x, y) = (2, 5)
E.g.2 Solve two linear equations simultaneously using the graph.
From the graph, determine the values of x and y that makes the linear equations true. y = x + 4 y = 6 - x