JHS2 Mathematics · Term 2, Week 6
Patterns and Relations
Lesson notes
Learning Objectives
Indicator: B8.2.1.1.3 - Use graphs of linear relations to solve real life problems.
By the end of the lesson, learners can:
- Interpret a given real-life linear graph by reading values from both the horizontal and vertical axes accurately.
- Translate a real-life scenario described in words into a table of values and plot the corresponding linear graph.
- Use a linear graph to answer questions involving missing inputs (e.g., time) and missing outputs (e.g., cost or distance), including interpolation and simple extrapolation.
- Explain, in their own words, the meaning of the gradient of a line in a real-life context (e.g., rate of walking, hourly charge).
- Justify their answers to real-life problems by referring to specific points or features on the graph they used.
Sign in with your phone number to read the full note and download the GES plan - free.
Sign in with phone numberCurriculum details
- Strand
- Algebra (Strand 2)
- Sub-strand
- Patterns and Relations (2.1)
- Content standard
- B8.2.1.1 - Demonstrate the ability to draw table of values for a linear relation, graph the relation in a number plane, determine the gradient of the line and use it to write equation of a line of the form y = mx + c.
- Indicator
- B8.2.1.1.3 - Use graphs of linear relations to solve real life problems.
- Suggested placement
-
Term 2, Week 6
(Week 18 of the year)
Our suggestion, laid out in curriculum order across three terms of twelve weeks. NaCCA does not fix the week, so follow your school's scheme of learning.
- Curriculum reference
-
Mathematics, Common Core Programme (JHS1-JHS3), 2023, p. 116
Transcribed from the official NaCCA publication. Check this page against the source.
Exemplars (from the NaCCA curriculum)
E.g.1 Draw graphs for real life problems.
i. Every morning, you go for a walk. The distance you walk can be modelled by the equation d = 1 h,where d is the distance walked in kilometers and h is the number 3
of hours you've walked. Make a table for the relation and draw a graph with the values to see how far you've walked after 6hours.
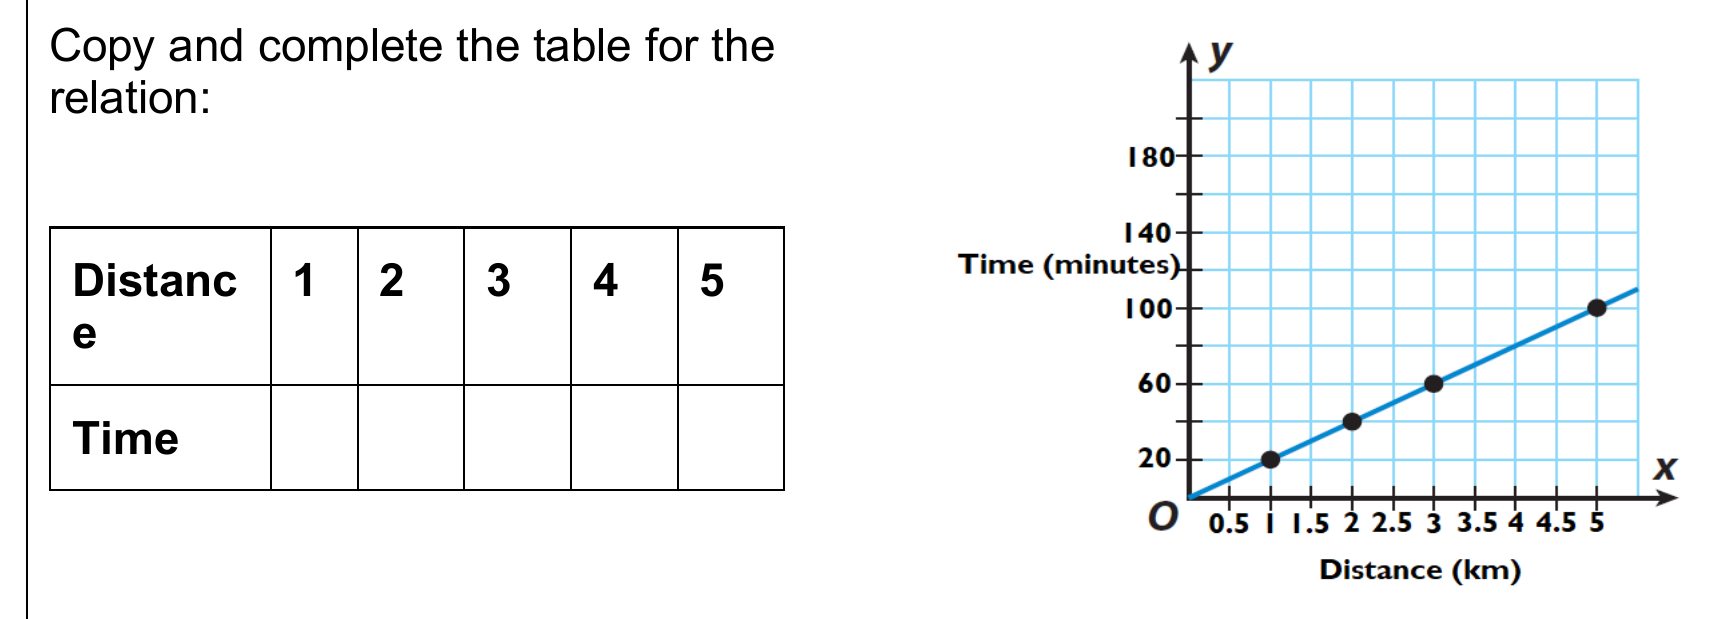
Copy and complete the table for the relation: Distanc 1 2 3 4 5 e Time
E.g.2 Nhyira paints portraits of people for a living. The graph below shows how much she charges based on how long it takes her to paint the portrait. Use the graph to answer the questions that follow.
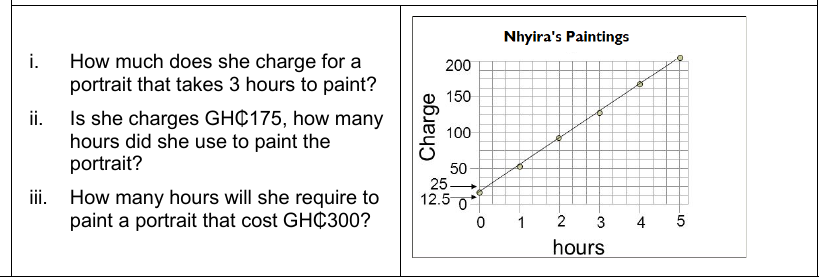
i. How much does she charge for a portrait that takes 3 hours to paint?
ii. Is she charges GH₵175, how many hours did she use to paint the portrait?
iii. How many hours will she require to paint a portrait that cost GH₵300?