JHS2 Mathematics · Term 2, Week 5
Patterns and Relations
Lesson notes
Learning Objectives
Indicator: B8.2.1.1.2 - Use graph of a linear relation to determine subsequent missing elements in the ordered pairs of the relation.
By the end of the lesson, learners can:
- Read values from the graph of a linear relation to find the missing y-coordinate when given an x-coordinate.
- Read values from the graph of a linear relation to find the missing x-coordinate when given a y-coordinate.
- Use the graph of a linear relation to complete a table of ordered pairs for given input values.
- Extrapolate from a graph to determine values beyond the plotted range and verify using the equation of the relation.
- Apply the skill of reading graphs to solve word problems involving linear relations in everyday situations.
Sign in with your phone number to read the full note and download the GES plan - free.
Sign in with phone numberCurriculum details
- Strand
- Algebra (Strand 2)
- Sub-strand
- Patterns and Relations (2.1)
- Content standard
- B8.2.1.1 - Demonstrate the ability to draw table of values for a linear relation, graph the relation in a number plane, determine the gradient of the line and use it to write equation of a line of the form y = mx + c.
- Indicator
- B8.2.1.1.2 - Use graph of a linear relation to determine subsequent missing elements in the ordered pairs of the relation.
- Suggested placement
-
Term 2, Week 5
(Week 17 of the year)
Our suggestion, laid out in curriculum order across three terms of twelve weeks. NaCCA does not fix the week, so follow your school's scheme of learning.
- Curriculum reference
-
Mathematics, Common Core Programme (JHS1-JHS3), 2023, p. 115
Transcribed from the official NaCCA publication. Check this page against the source.
Exemplars (from the NaCCA curriculum)
E.g.1 Use information from a graph to find missing elements
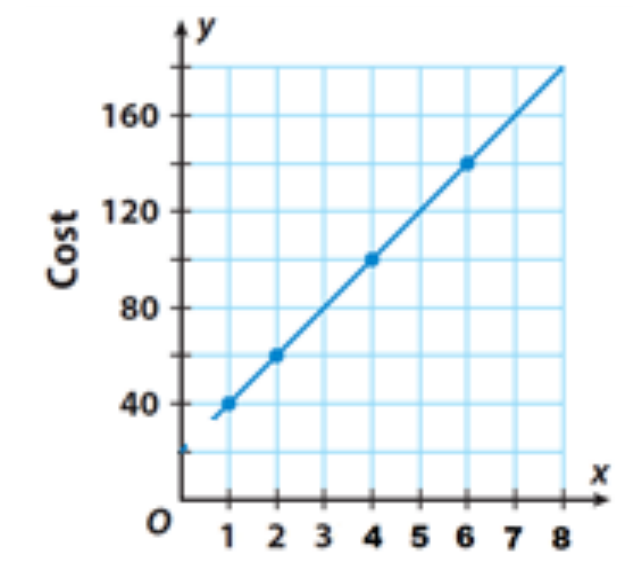
The graph represents the relation y = 20x, where y is the cost (in Ghana cedis) of the weight (in kilograms) of meat sold in a market. Use the graph to find:
i. the cost of 3.5kg of meat
ii. the weight of meat that can be bought with GH₵80.
iii. Using the relation from the graph, how many kilograms of meat can be bought at a cost of GH₵240.
E.g.2 Use information from a graph to The diameter of a Wawa tree is currently 10 find missing elements: inches when it is measured at chest height. After 50 years, the diameter is expected to increase by an average growth rate of 2 inch
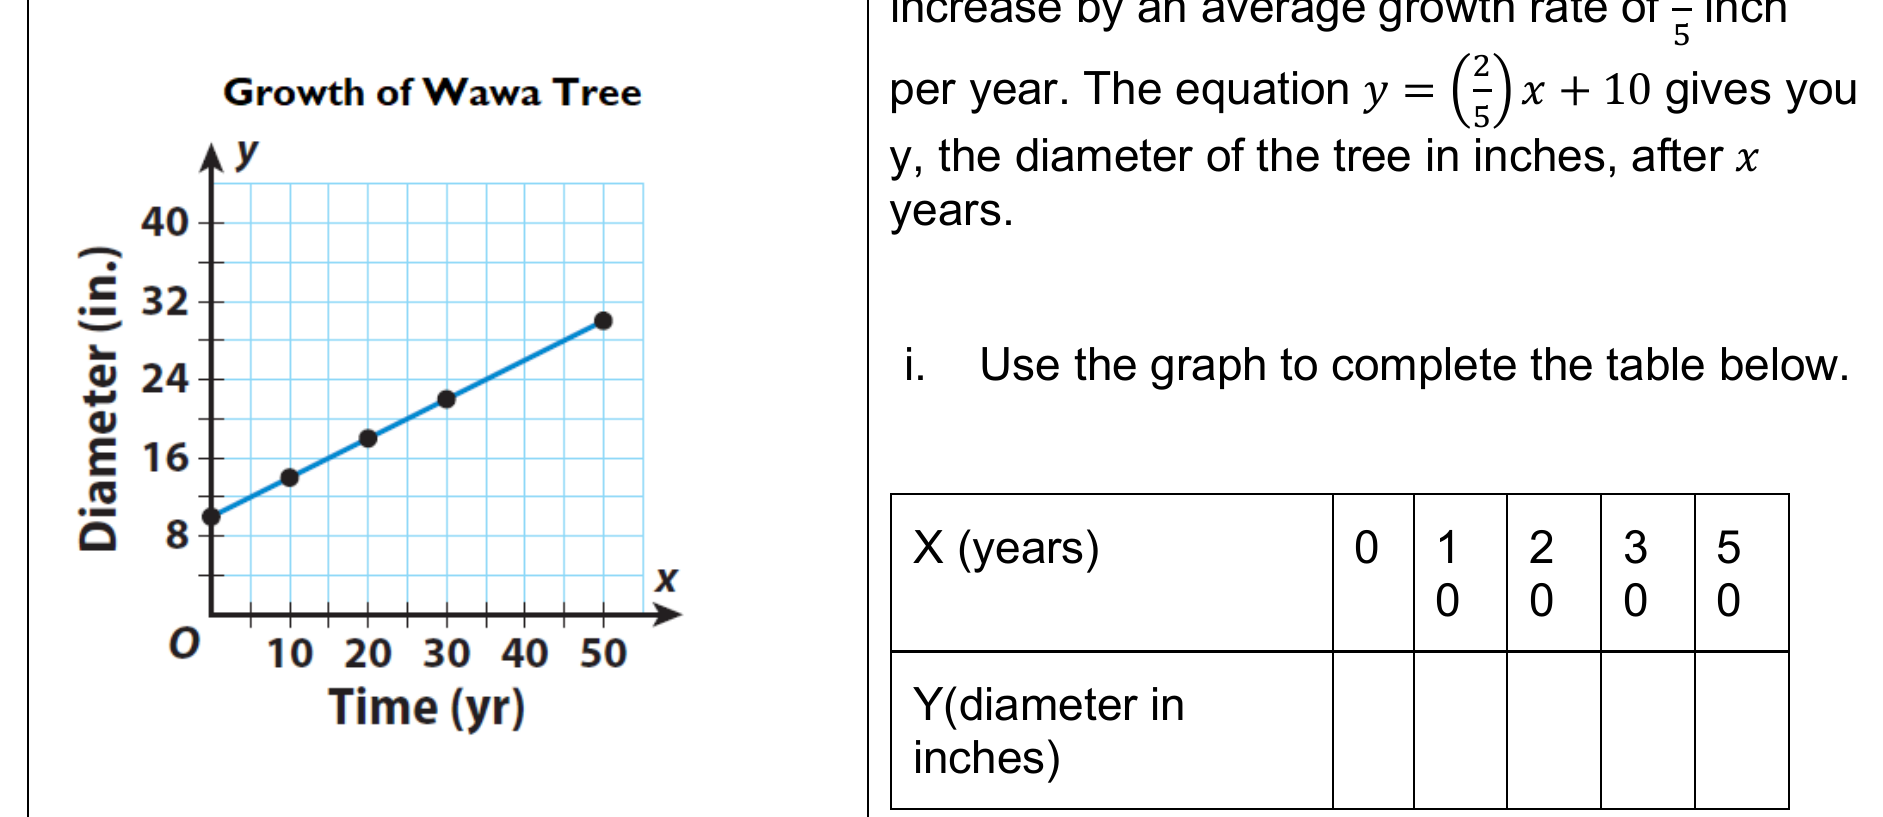
5
per year. The equation y = ( 2 ) x + 10 gives you 5
y, the diameter of the tree in inches, after x years.
i. Use the graph to complete the table below. X (years) 0 1 2 3 5
0 0 0 0
Y(diameter in inches)
ii. What will be the diameter of the tree in 100 years?