JHS1 Mathematics · Term 2, Week 4
Patterns and Relations
Lesson notes
Learning Objectives
Indicator: B7.2.1.1.4 - Locate points on the number plane, draw a table of values of a given relation, draw graphs for given relations and use them to solve problems.
By the end of the lesson, learners can:
- Locate and plot points on the Cartesian (number) plane given their coordinates, including points with negative x and y values.
- Complete a table of values for a given rule such as x → 2x + 1 or x → x² + 2 on a specified domain.
- Plot points from a table of values on a number plane and draw the graph of the relation.
- Read coordinates of points from a graph and use the number plane to answer questions about positions and distances.
- Solve simple practical problems by interpreting points on a number plane.
Sign in with your phone number to read the full note and download the GES plan - free.
Sign in with phone numberCurriculum details
- Strand
- Algebra (Strand 2)
- Sub-strand
- Patterns and Relations (2.1)
- Content standard
- B7.2.1.1 - Derive the rule for a set of points of a relation, draw a table of values to graph the relation in a number plane and make predictions about subsequent elements of the relation.
- Indicator
- B7.2.1.1.4 - Locate points on the number plane, draw a table of values of a given relation, draw graphs for given relations and use them to solve problems.
- Suggested placement
-
Term 2, Week 4
(Week 16 of the year)
Our suggestion, laid out in curriculum order across three terms of twelve weeks. NaCCA does not fix the week, so follow your school's scheme of learning.
- Curriculum reference
-
Mathematics, Common Core Programme (JHS1-JHS3), 2023, p. 31
Transcribed from the official NaCCA publication. Check this page against the source.
Exemplars (from the NaCCA curriculum)
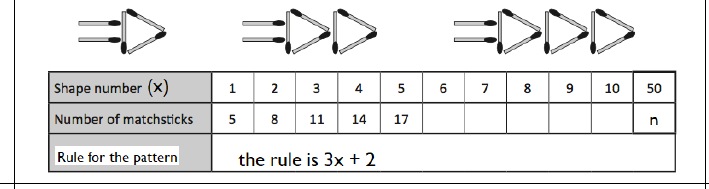
E.g.1 Make a table of values for a given rule: I. Draw a table for the mapping defined by the rule on the domain {-2, -1, 0, 1, 2, 3} Rule: x → 2x + 1
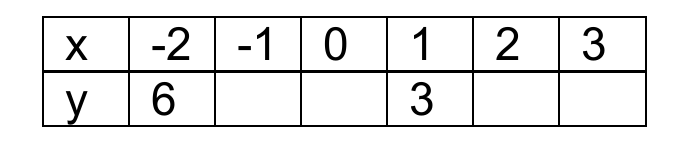
x -2 -1 0 1 2 3 y -3 5
ii. Draw a table for the mapping defined by the rule on the domain
{-2, -1, 0, 1, 2, 3} Rule: x → x 2 + 2
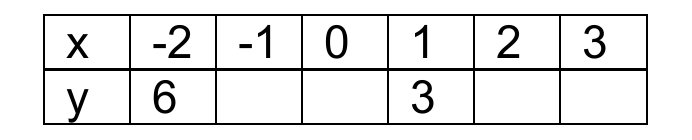
x -2 -1 0 1 2 3 y 6 3
E.g.2Locate points on the number plane - (1, 2) and (-3, 2)
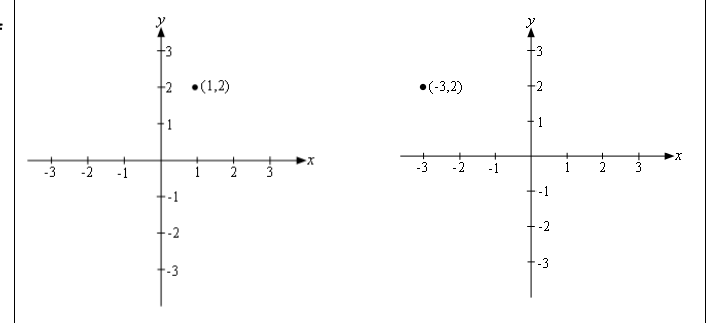
E.g.3 Draw graphs for given relations
i. Plot the table of values on a number plane
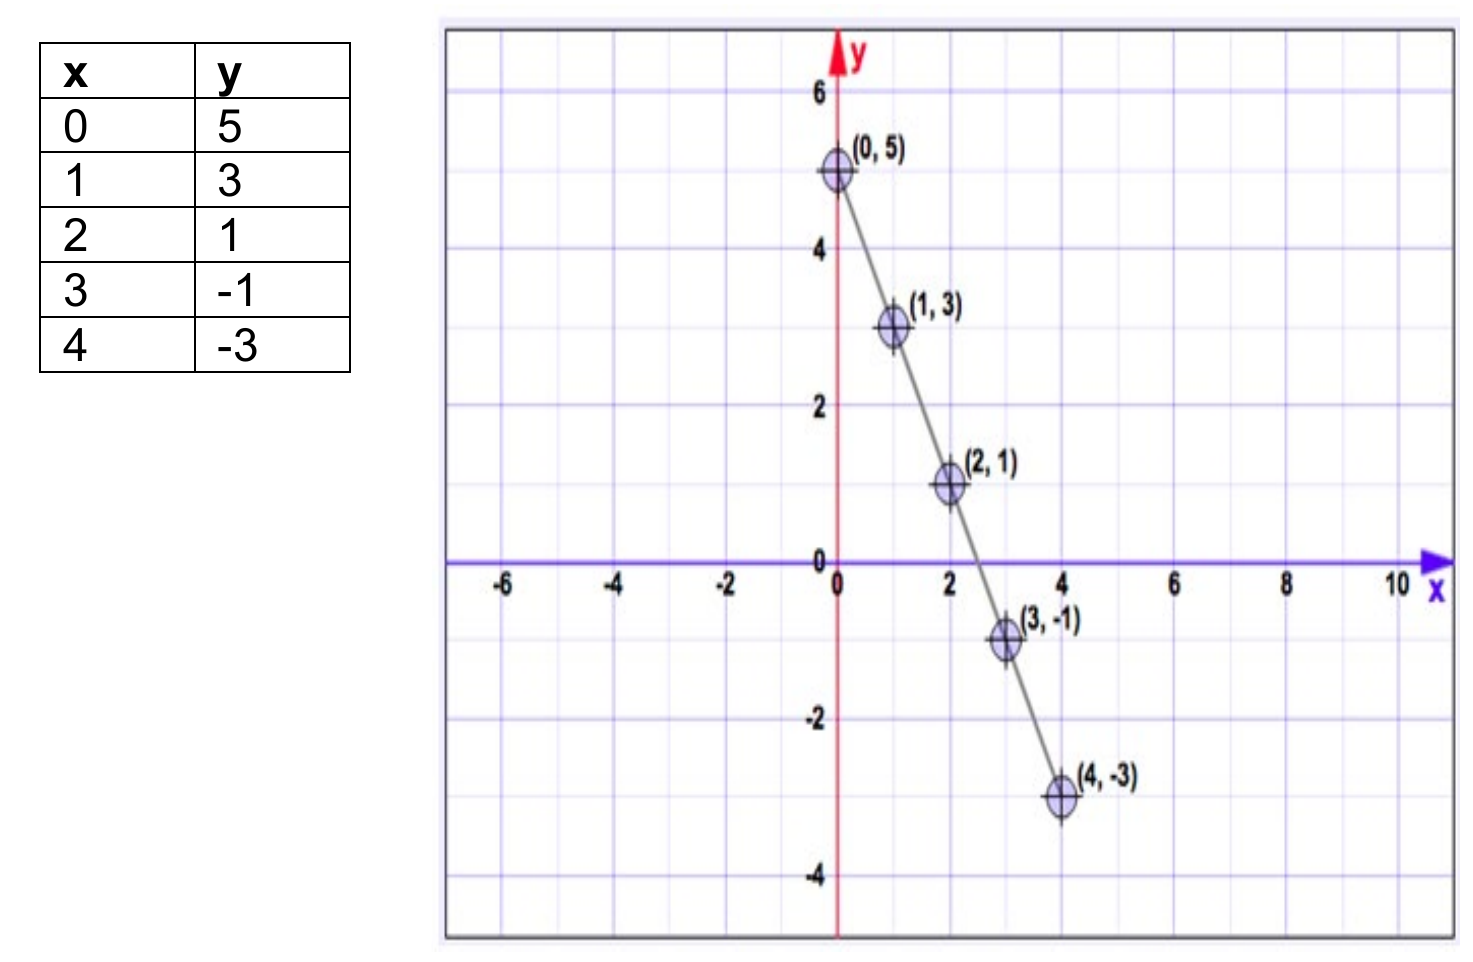
x y 0 5 1 3 2 1 3 -1 4 -3
E.g.4 Use knowledge of identifying and plotting points in a number plane to solve problems. The number plane shows the location of animals.
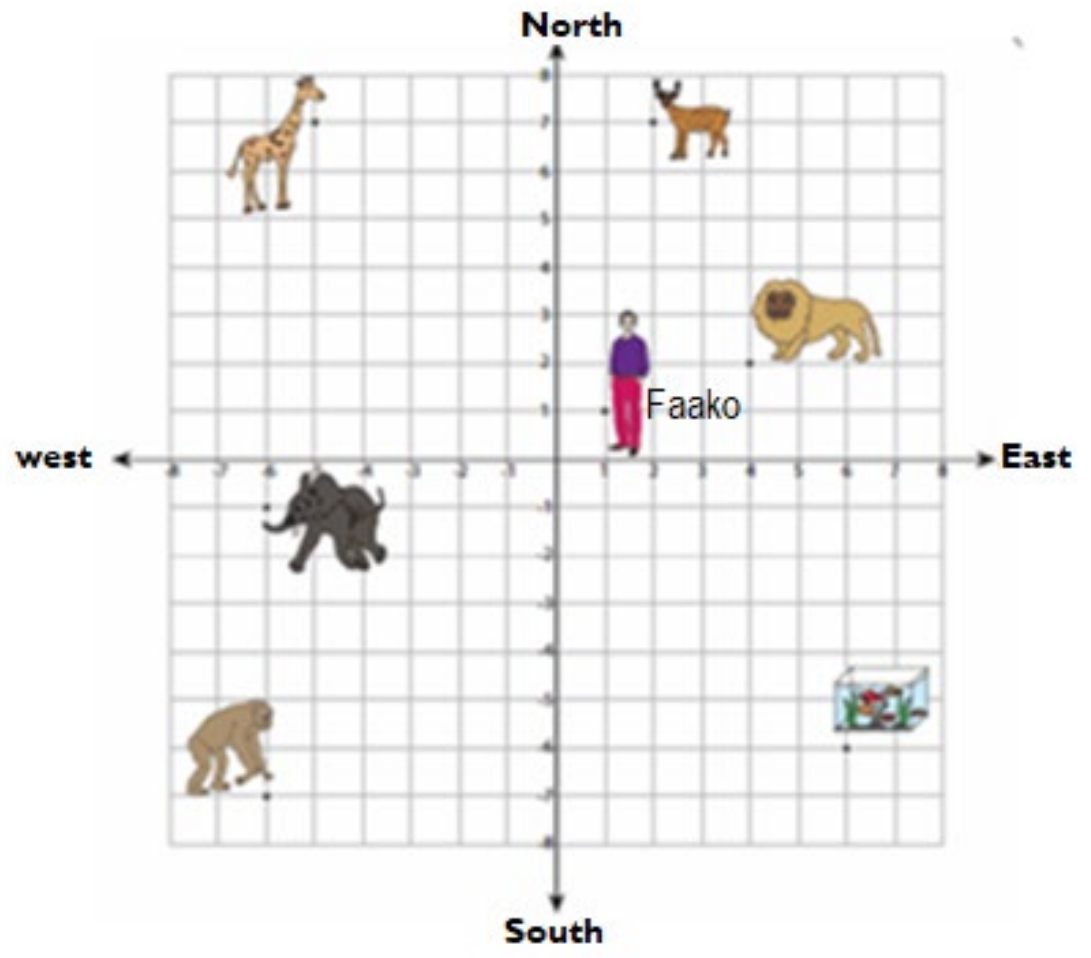
Use the plane to answer the questions that follow.
i. If Faako walks 7 units west and 8 units south, which animal does he see?
ii. Which animal is closest to Faako?
iii. Which animal is located at the point (2, 7)?
iv. What is point at which the giraffe is located?