JHS3 Mathematics · Term 2, Week 2
Number: Ratios and Proportion
Lesson notes
Learning Objectives
Indicator: B9.1.4.1.4 - Recognise and graph proportional relationships, interpreting the unit rate as the slope of the graph and use these to solve problems.
By the end of the lesson, learners can:
- Identify whether a relationship is proportional by checking if the graph passes through the origin (0, 0).
- Determine the unit rate from a table of values or a graph, and state it as the slope of the line.
- Plot points from a proportional relationship table on a coordinate grid and draw the straight line through them.
- Read values from a proportional graph to answer questions such as cost, distance, or quantity.
- Use the slope (unit rate) to calculate missing values and solve word problems set in everyday situations.
Sign in with your phone number to read the full note and download the GES plan - free.
Sign in with phone numberCurriculum details
- Strand
- Number (Strand 1)
- Sub-strand
- Number: Ratios and Proportion (1.4)
- Content standard
- B9.1.4.1 - Apply the understanding of ratio, rate and proportions to solve problems that involve rates, ratios, and proportional reasoning and use it to solve real- world mathematical problems.
- Indicator
- B9.1.4.1.4 - Recognise and graph proportional relationships, interpreting the unit rate as the slope of the graph and use these to solve problems.
- Suggested placement
-
Term 2, Week 2
(Week 14 of the year)
Our suggestion, laid out in curriculum order across three terms of twelve weeks. NaCCA does not fix the week, so follow your school's scheme of learning.
- Curriculum reference
-
Mathematics, Common Core Programme (JHS1-JHS3), 2023, p. 179
Transcribed from the official NaCCA publication. Check this page against the source.
Exemplars (from the NaCCA curriculum)
E.g.1The graph below shows the cost of avocados.
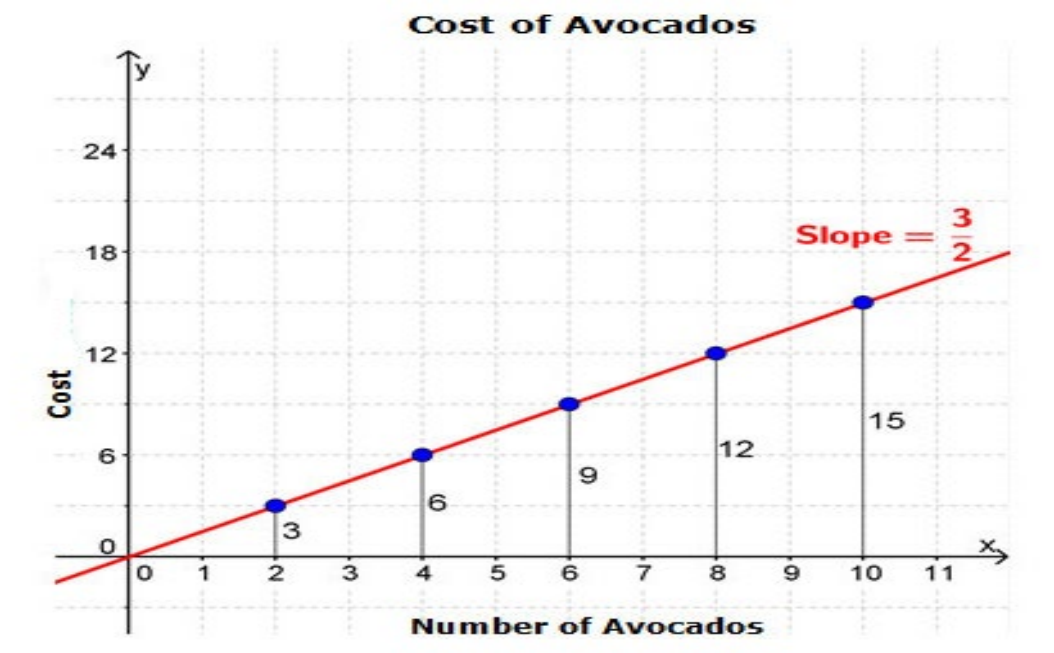
The unit rate, from the data, is ₵1.50 per avocado, which is the same as the slope of the line connecting the data points ( 3 ). 2
i. From the graph, how much does eight avocados cost?
ii. Also, using the graph how much does 15 avocados cost?