JHS2 Mathematics · Term 2, Week 3
Number: Ratios and Proportion
Lesson notes
Learning Objectives
Indicator: B8.1.4.1.4 - Recognise and represent proportional relationships between quantities by deciding whether two quantities are in a proportional relationship.
By the end of the lesson, learners can:
- Determine whether two quantities form a proportional relationship by testing for equivalent ratios in a given table.
- Create a table of values from a verbal description of a relationship between two quantities.
- Plot points from a table on a coordinate plane and observe whether the resulting graph is a straight line through the origin.
- Distinguish between proportional relationships (straight line through origin) and non-proportional relationships (line not through origin, or not a straight line) using graphs.
- Justify their decision about whether a relationship is proportional using evidence from both tables and graphs.
Sign in with your phone number to read the full note and download the GES plan - free.
Sign in with phone numberCurriculum details
- Strand
- Number (Strand 1)
- Sub-strand
- Number: Ratios and Proportion (1.4)
- Content standard
- B8.1.4.1 - Demonstrate an understanding of ratio, rate and proportions and use it these to solve real-world mathematical problems. Notes: put a passage for the graph
- Indicator
- B8.1.4.1.4 - Recognise and represent proportional relationships between quantities by deciding whether two quantities are in a proportional relationship. (e.g. by testing for equivalent ratios in a table or graphing on a coordinate plane and observing whether the graph is a straight line through the origin).
- Suggested placement
-
Term 2, Week 3
(Week 15 of the year)
Our suggestion, laid out in curriculum order across three terms of twelve weeks. NaCCA does not fix the week, so follow your school's scheme of learning.
- Curriculum reference
-
Mathematics, Common Core Programme (JHS1-JHS3), 2023, p. 109
Transcribed from the official NaCCA publication. Check this page against the source.
Exemplars (from the NaCCA curriculum)
E.g.1 Use given tables to check proportional E.g.2 Use graphs to check proportional relationships. and non-proportional relationship
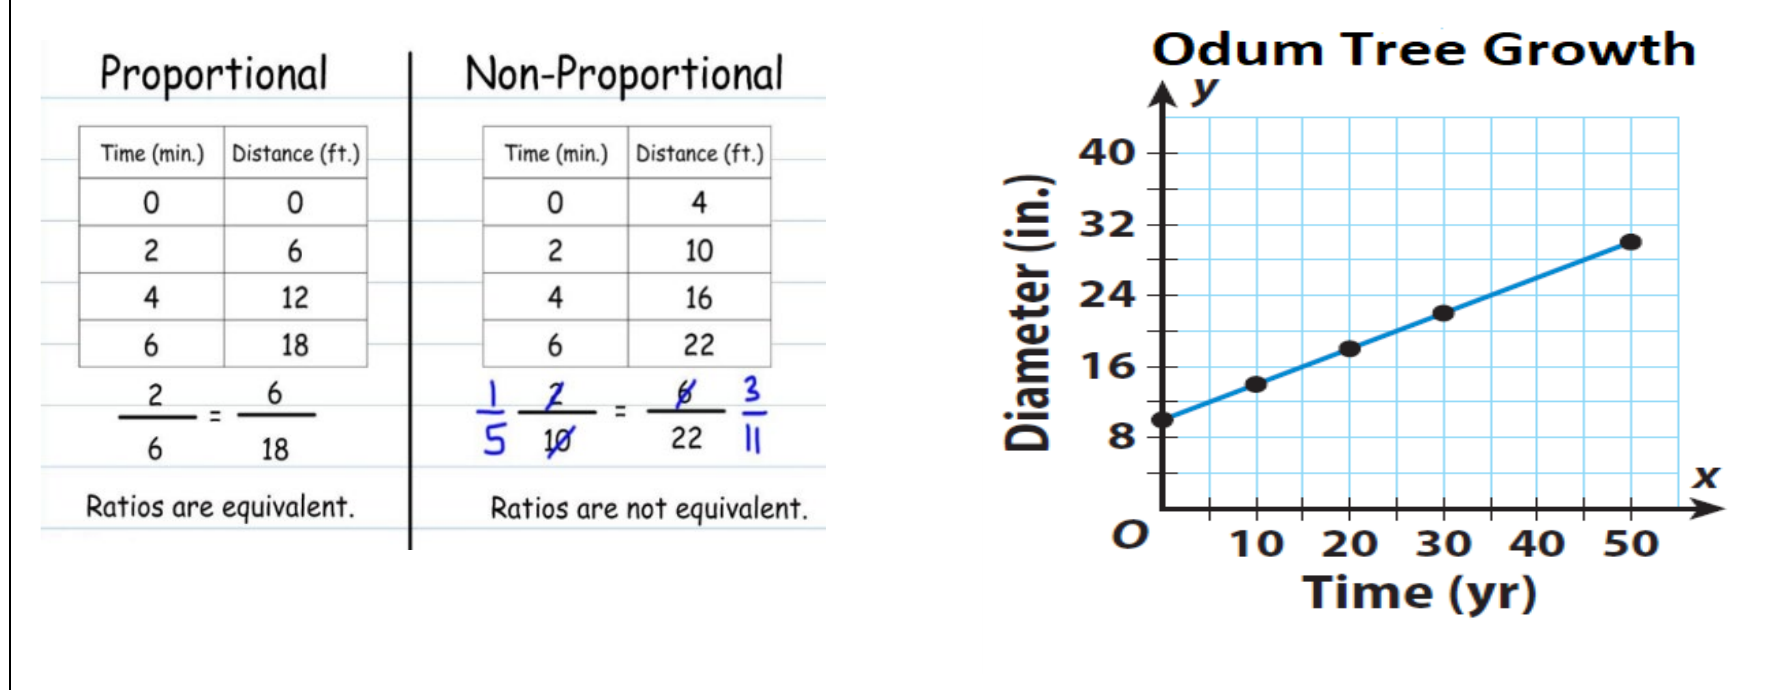
The graph shows a non-proportional relationship because the straight line does not go through the origin.