JHS2 Mathematics · Term 2, Week 4
Number: Ratios and Proportion
Lesson notes
Learning Objectives
Indicator: B8.1.4.1.5 - Identify the constant of proportionality (unit rate) in tables, graphs, equations, diagrams, and verbal descriptions of proportional relationships.
By the end of the lesson, learners can:
- Define the constant of proportionality as the unit rate in a proportional relationship and state it as a ratio in the form k = y/x.
- Identify the constant of proportionality from a table by dividing each output value by its corresponding input value.
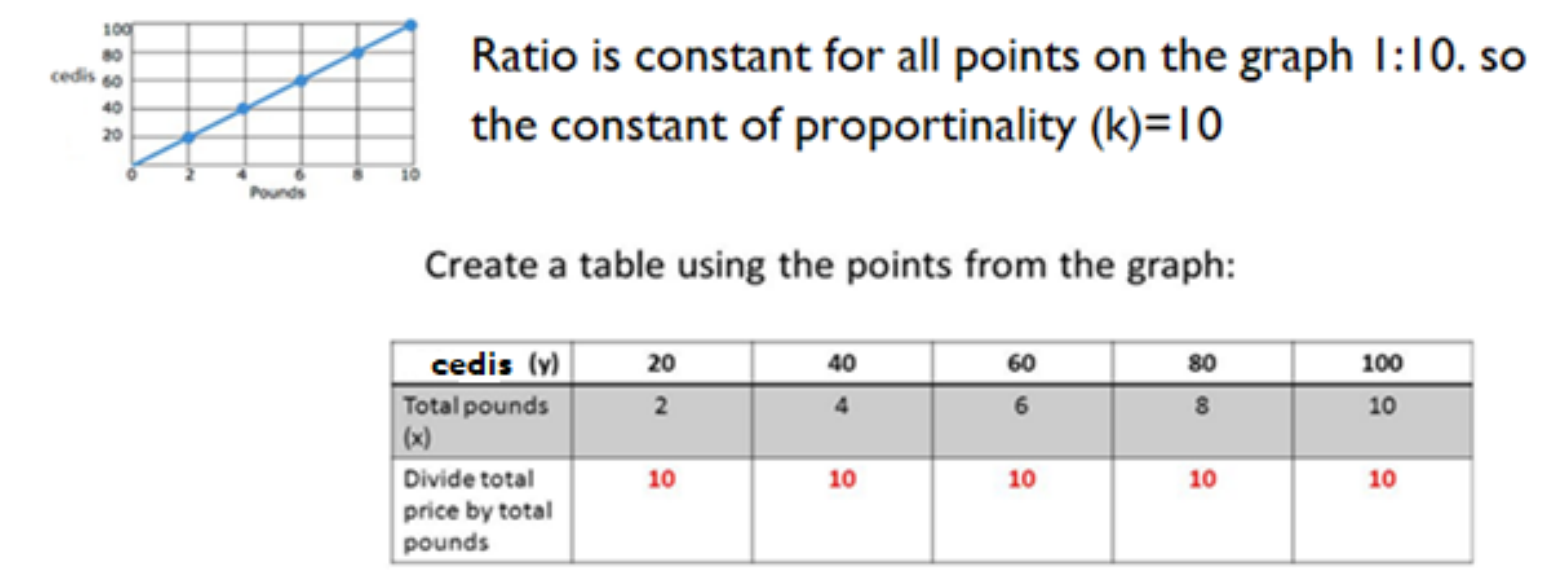
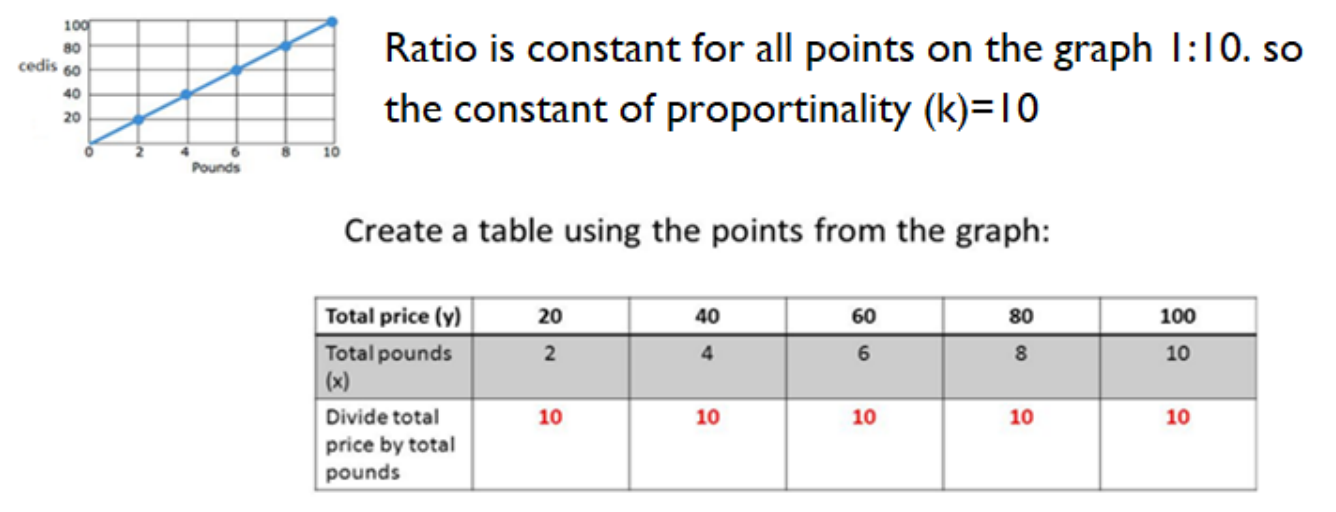
- Identify the constant of proportionality from a graph by finding the slope of the straight line passing through the origin.
- Write and interpret the equation y = kx for a proportional relationship, given the value of k.
- Determine the constant of proportionality from a verbal description or a diagram and use it to answer related questions.
Sign in with your phone number to read the full note and download the GES plan - free.
Sign in with phone numberCurriculum details
- Strand
- Number (Strand 1)
- Sub-strand
- Number: Ratios and Proportion (1.4)
- Content standard
- B8.1.4.1 - Demonstrate an understanding of ratio, rate and proportions and use it these to solve real-world mathematical problems. Notes: put a passage for the graph
- Indicator
- B8.1.4.1.5 - Identify the constant of proportionality (unit rate) in tables, graphs, equations, diagrams, and verbal descriptions of proportional relationships.
- Suggested placement
-
Term 2, Week 4
(Week 16 of the year)
Our suggestion, laid out in curriculum order across three terms of twelve weeks. NaCCA does not fix the week, so follow your school's scheme of learning.
- Curriculum reference
-
Mathematics, Common Core Programme (JHS1-JHS3), 2023, p. 110
Transcribed from the official NaCCA publication. Check this page against the source.
Exemplars (from the NaCCA curriculum)
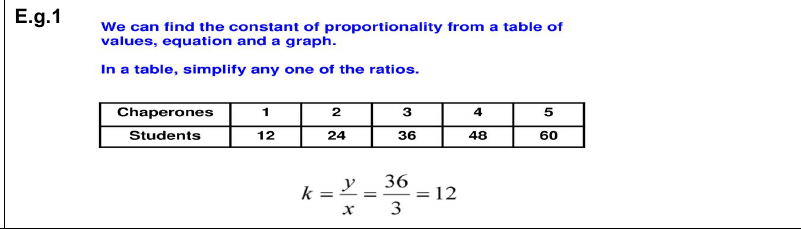
E.g.1
E.g.2 An ant travels 9 inches in 45 seconds and 27 inches in 2 minutes and 15 seconds. 8 8
What is the constant of proportionality?
E.g.3