B5 Mathematics · Term 2, Week 6
Number
Lesson notes
Learning Objectives
Indicator: B5.1.5.1.2 - Determine the benchmark percentages from their common fractions and use these to estimate percentages of quantities
By the end of the lesson, learners can:
- State the common fraction equivalents for benchmark percentages (50%, 25%, 10%, 20%, 75%, and 100%) from memory.
- Match each benchmark percentage to its equivalent fraction using a pictorial chart.
- Estimate percentages of given quantities by selecting the nearest benchmark percentage.
- Determine exact percentages of quantities by converting the percentage to a common fraction and multiplying.
- Justify their estimates by comparing the benchmark result with the exact calculation.
Sign in with your phone number to read the full note and download the GES plan - free.
Sign in with phone numberCurriculum details
- Strand
- Number (Strand 1)
- Content standard
- B5.1.5.1 - Demonstrate understanding of percentage of a given number
- Indicator
- B5.1.5.1.2 - Determine the benchmark percentages from their common fractions and use these to estimate percentages of quantities
- Suggested placement
-
Term 2, Week 6
(Week 18 of the year)
Our suggestion, laid out in curriculum order across three terms of twelve weeks. NaCCA does not fix the week, so follow your school's scheme of learning.
- Source document note
-
The official curriculum document has a fault in this entry, so the curriculum text above is transcribed exactly as printed:
- exemplars - p.82
- Curriculum reference
-
Mathematics Curriculum for Primary Schools (Basic 4-6), 2019, p. 82
Transcribed from the official NaCCA publication. Check this page against the source.
Exemplars (from the NaCCA curriculum)
E.g. 1 Use pictorial representations and chart to display common or benchmarks percentages and ask pupils to determine these from their equivalent common fractions.
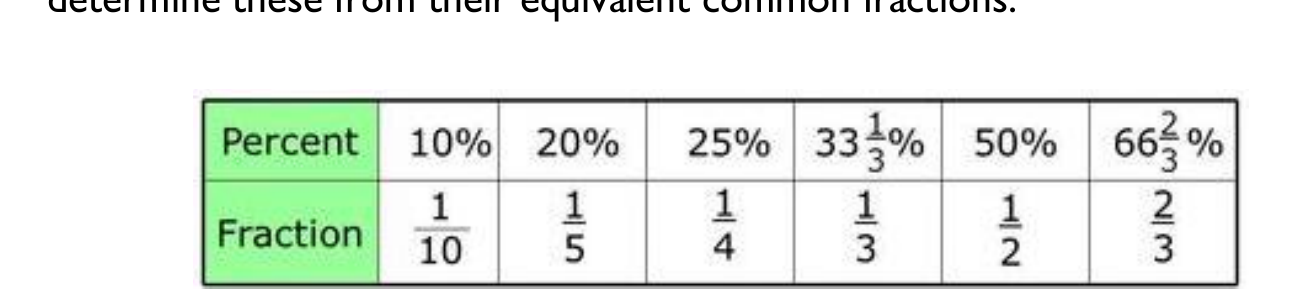
E.g. 2 Give learners practice through drills and games to learn the equivalences of the benchmark fractions
E.g. 3 Ask pupils to use the benchmarks for estimating percentages of given quantities. E.g. for "what is 60% of 45?" using the nearest benchmark fraction (i.e. 50%) the learner will know the expected result is close to 30; the learner can use benchmark fractions to determine the result mentally by finding which can easily multiply 45, and in this case 1/5 to give 9. Since 1/5 is 20%, then the 60% required will be 3 times 9 which is 27.
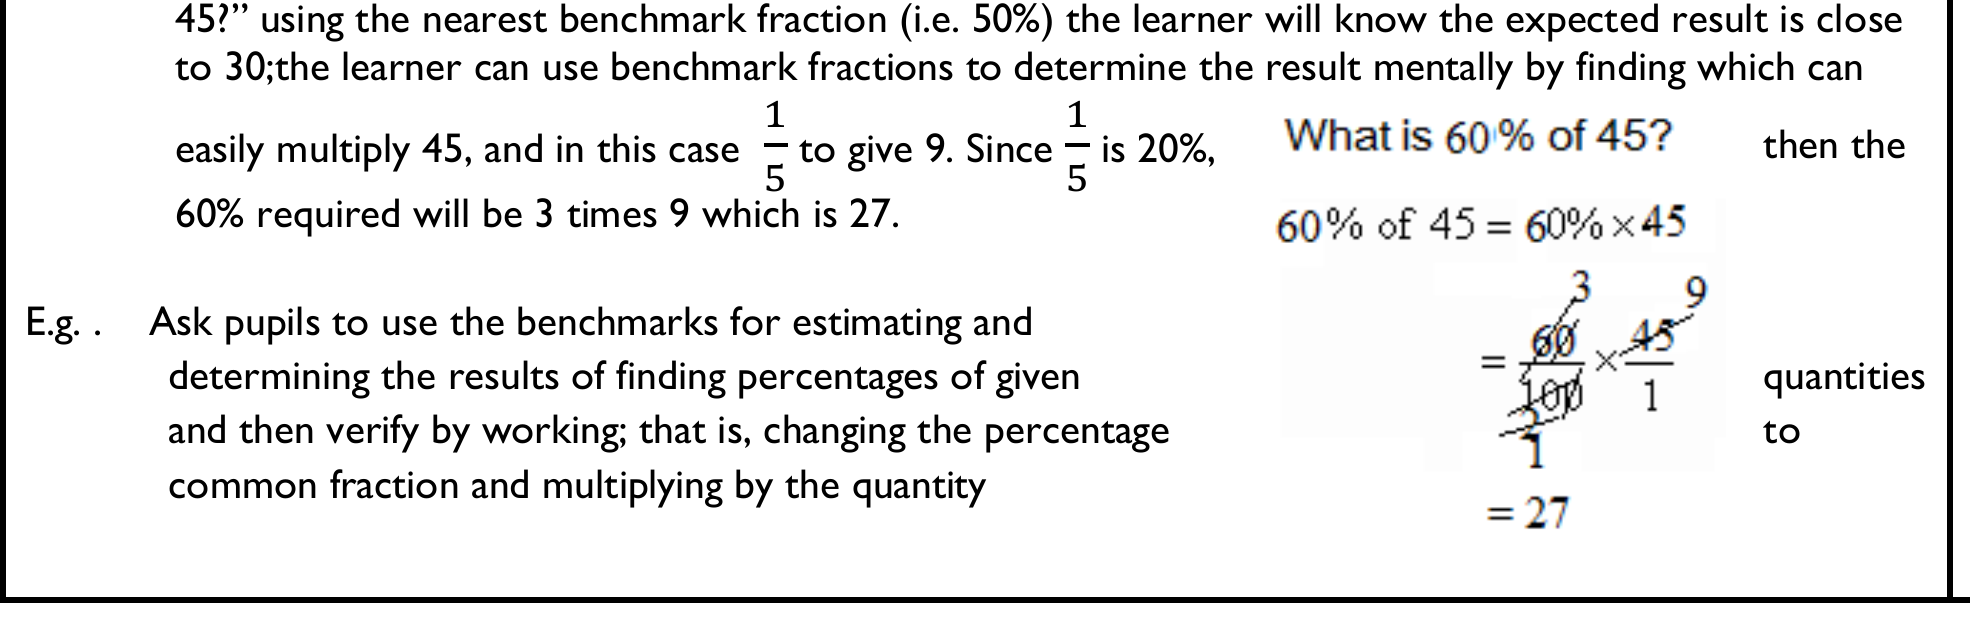
E.g. . Ask pupils to use the benchmarks for estimating and determining the results of finding percentages of given quantities and then verify by working; that is, changing the percentage to common fraction and multiplying by the quantity The document numbers the last exemplar "E.g. ." with no number. The fractions are stacked and are written inline.