B4 Mathematics · Term 2, Week 5
Number
Lesson notes
Learning Objectives
Indicator: B4.1.5.1.1 - Model or recognise percent (as a fraction related to hundredths) using concrete models, pictorial representations and number line.
By the end of the lesson, learners can:
- Shade a 10 by 10 grid to show a given percent (e.g. 25%, 50%, 75%) and state the corresponding fraction out of 100.
- Represent percentages on a number line from 0% to 100%, placing common values such as 25%, 50% and 75% in the correct positions.
- Convert a fraction with denominator 100 into its percent name (e.g. 35/100 = 35%) and draw a pictorial model to match.
- Identify the shaded portion of a pictorial representation and express it as a fraction out of 100, a decimal, and a percent.
- Explain in their own words that “percent” means “out of one hundred” using concrete models such as grid paper or counters.
Sign in with your phone number to read the full note and download the GES plan - free.
Sign in with phone numberCurriculum details
- Strand
- Number (Strand 1)
- Content standard
- B4.1.5.1 - Demonstrate an understanding of percent (limited to whole numbers) concretely, pictorially, and symbolically)
- Indicator
- B4.1.5.1.1 - Model or recognise percent (as a fraction related to hundredths) using concrete models, pictorial representations and number line.
- Suggested placement
-
Term 2, Week 5
(Week 17 of the year)
Our suggestion, laid out in curriculum order across three terms of twelve weeks. NaCCA does not fix the week, so follow your school's scheme of learning.
- Source document note
-
The official curriculum document has a fault in this entry, so the curriculum text above is transcribed exactly as printed:
- exemplars - p.28
- Curriculum reference
-
Mathematics Curriculum for Primary Schools (Basic 4-6), 2019, p. 28
Transcribed from the official NaCCA publication. Check this page against the source.
Exemplars (from the NaCCA curriculum)
E.g. 1. Use several pictorial representations or number line to introduce tenths and hundredths and ask pupils to identify the fractions (i.e. A, B, C, D, & E).
E.g. 2. Use long division method to convert and write fractions as decimals in the number chart.
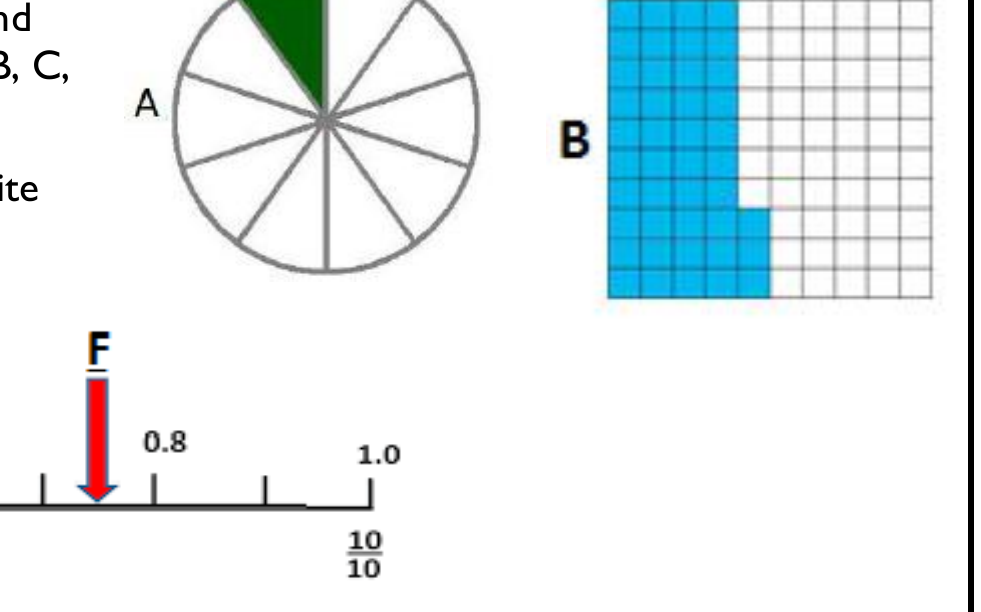
E.g. 3. Give pupils several common fractions (including improper fractions) to convert into hundredths and write their decimal names or use long division; e.g. 3/4 = 75/100 = 75%.
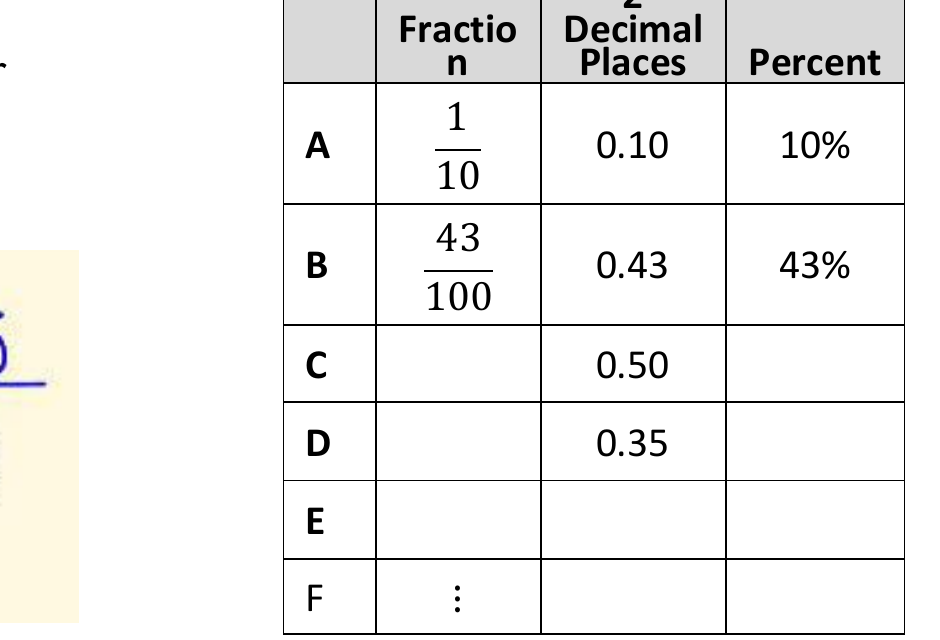
The Fraction / Decimal Places / Percent table (rows A to F) is set beside E.g. 3 and its cells interleave with the exemplar in the text layer; the figure shows it. The fractions are stacked and are written inline.