JHS1 Mathematics · Term 1, Week 8
Fractions, Decimals and Percentages
Lesson notes
Learning Objectives
Indicator: B7.1.3.1.1 - Determine and recall the percentages and decimals of given benchmark fractions (i.e. tenths, fifths, fourths, thirds and halves) and use these to compare quantities.
By the end of the lesson, learners can:
- State the decimal and percentage equivalents of benchmark fractions including halves, thirds, fourths, fifths and tenths.
- Complete a conversion table linking common fractions, decimals and percentages for benchmark fractions.
- Use benchmark fraction equivalences to compare two quantities and insert the correct symbol (<, = or >).
- Identify whether a given fraction is closer to 0, 1/2 or 1 using knowledge of benchmark fractions.
- Solve simple real-life problems by converting between fractions, decimals and percentages.
Sign in with your phone number to read the full note and download the GES plan - free.
Sign in with phone numberCurriculum details
- Strand
- Number (Strand 1)
- Sub-strand
- Fractions, Decimals and Percentages (1.3)
- Content standard
- B7.1.3.1 - Simplify, compare and order a mixture of positive fractions (i.e. common, percent and decimal) by changing all to equivalent (i) fractions (ii) decimals, or (iii) percentages.
- Indicator
- B7.1.3.1.1 - Determine and recall the percentages and decimals of given benchmark fractions (i.e. tenths, fifths, fourths, thirds and halves) and use these to compare quantities.
- Suggested placement
-
Term 1, Week 8
(Week 8 of the year)
Our suggestion, laid out in curriculum order across three terms of twelve weeks. NaCCA does not fix the week, so follow your school's scheme of learning.
- Curriculum reference
-
Mathematics, Common Core Programme (JHS1-JHS3), 2023, p. 17
Transcribed from the official NaCCA publication. Check this page against the source.
Exemplars (from the NaCCA curriculum)
E.g. 1. Review the concept of fractions.

i. Shade given fraction of squares in given shapes: i.e. shade 5 of the rectangle. 6
ii. Write down 3 fractions equivalent to 2 3
iii. Express the fraction 6 in its simplest form: 6 = 3
10 10 5
iv. Convert to mixed numbers: 12 5
v. Convert to improper fractions: 2 5 9
E.g. 2. Work out common, and decimal fractions and percent equivalences of given benchmark fractions to complete a table.
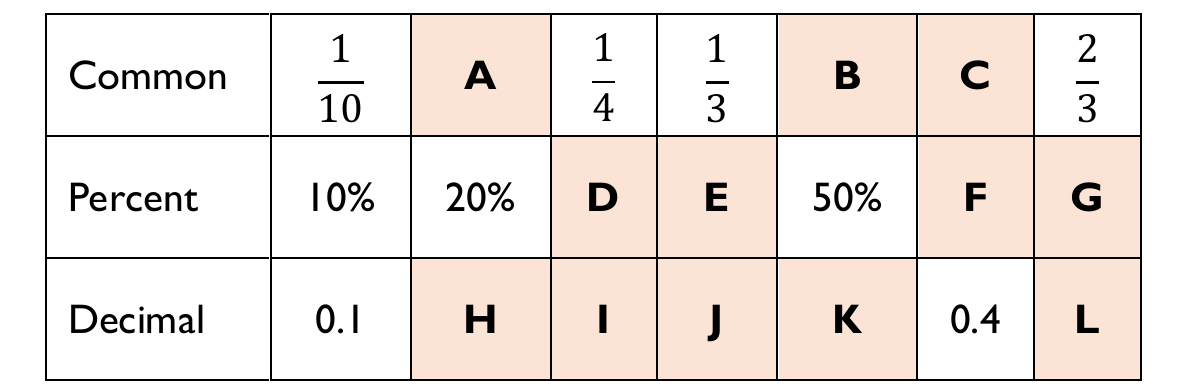
1 1 1 2
Common A B C
10 4 3 3
Percent 10% 20% D E 50% F G Decimal 0.1 H I J K 0.4 L
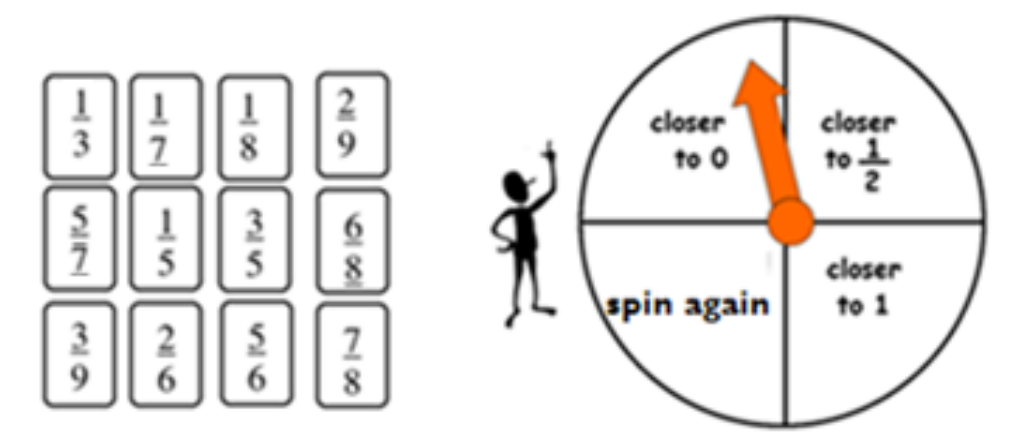
E.g. 3. Identifying fractions which are (i) closer to half; (ii) closer to one; and
(iii) closer to zero in games with fraction cards and fraction wheel. Spin the fraction wheel and pick the right fraction to win a fraction card. [Note cards picked should not be replaced].
E.g. 4. Simplify, compare and order common fractions.
i. Determine the fraction which is the simplest form of a given set of fractions. Example, what is the simplest form of the fraction represented by the diagram below?
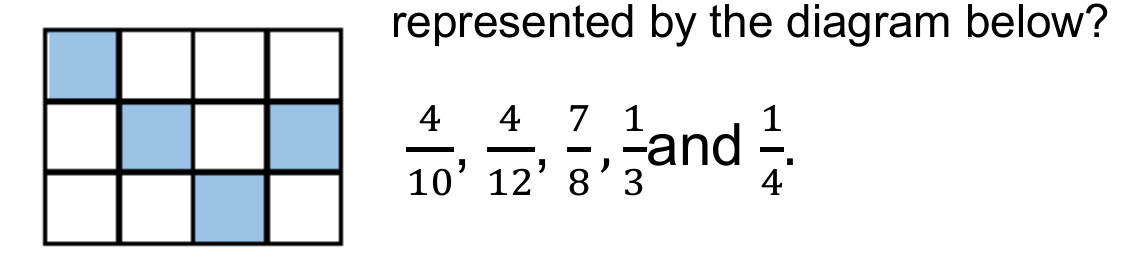
10 12 8 3 4
ii. Which symbol (<, = or >) makes the sentence " 3 … 2 " true? 5 3
iii. Find which fraction is greater: 7 and 8 . 12 10