JHS3 Mathematics · Term 3, Week 8
Data
Lesson notes
Learning Objectives
Indicator: B9.4.1.1.3 - Use a histogram to determine the mode of a given data to solve and/or pose real life cases.
By the end of the lesson, learners can:
- Identify the modal class from a histogram as the bar with the greatest height.
- Draw a histogram from a grouped frequency table with continuous class intervals.
- Use the histogram to determine the modal class and estimate the mode of a given data set.
- Solve real-life problems by interpreting the modal class from histograms of data collected in everyday situations.
- Pose their own real-life question, collect or use given data, draw a histogram, and state the modal class with a justification.
Sign in with your phone number to read the full note and download the GES plan - free.
Sign in with phone numberCurriculum details
- Strand
- Handling Data (Strand 4)
- Sub-strand
- Data (4.1)
- Content standard
- B9.4.1.1 - Select, justify, and use appropriate methods of collecting data (grouped/ungrouped), use the data to construct and interpret frequency tables and histogram and use it to determine the mode and to solve and/or pose problems.
- Indicator
- B9.4.1.1.3 - Use a histogram to determine the mode of a given data to solve and/or pose real life cases.
- Suggested placement
-
Term 3, Week 8
(Week 32 of the year)
Our suggestion, laid out in curriculum order across three terms of twelve weeks. NaCCA does not fix the week, so follow your school's scheme of learning.
- Curriculum reference
-
Mathematics, Common Core Programme (JHS1-JHS3), 2023, p. 214
Transcribed from the official NaCCA publication. Check this page against the source.
Exemplars (from the NaCCA curriculum)
E.g. 1- The waiting times, x minutes, for 60 patients at a certain clinic are as follows
i. Construct a frequency table using class intervals 0 - 10.5; 10.5 - 20.5; 20.5- 30.5, and so on.
ii. Construct a frequency table using class intervals 0 <×≤ 10; 10 <×≤ 20;
20 <×≤ 30, and so on.
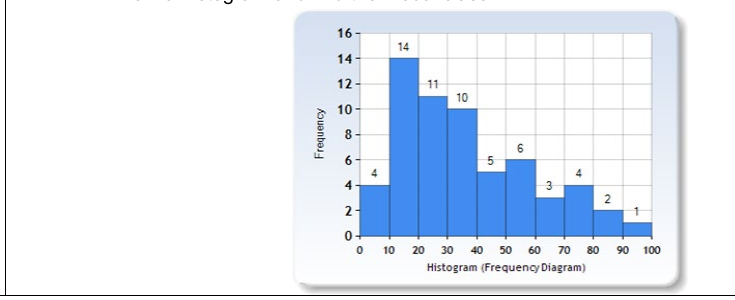
iv. Draw a histogram and find the modal class.