JHS2 Mathematics · Term 3, Week 11
Data
Lesson notes
Learning Objectives
Indicator: B8.4.1.2.2 - Justify a context in which the mean, median or mode is the most appropriate measure of central tendency to use when reporting findings.
By the end of the lesson, learners can:
- Calculate the mean, median, and mode for a given set of ungrouped data and state the range.
- Explain how the presence of an outlier affects the mean more than the median or mode.
- Identify the most appropriate measure of central tendency for a given context and justify their choice in writing or orally.
- Justify why the median is preferred over the mean when a data set contains extreme values.
- Determine when the mode is the most suitable measure, particularly for categorical data or when identifying the most common or typical value is the aim.
Sign in with your phone number to read the full note and download the GES plan - free.
Sign in with phone numberCurriculum details
- Strand
- Handling Data (Strand 4)
- Sub-strand
- Data (4.1)
- Content standard
- B8.4.1.2 - Demonstrate an understanding of measures of central tendency (mean, median, mode) and range for grouped data and explain when it's most appropriate to use the mean, median, or mode.
- Indicator
- B8.4.1.2.2 - Justify a context in which the mean, median or mode is the most appropriate measure of central tendency to use when reporting findings.
- Suggested placement
-
Term 3, Week 11
(Week 35 of the year)
Our suggestion, laid out in curriculum order across three terms of twelve weeks. NaCCA does not fix the week, so follow your school's scheme of learning.
- Curriculum reference
-
Mathematics, Common Core Programme (JHS1-JHS3), 2023, p. 160
Transcribed from the official NaCCA publication. Check this page against the source.
Exemplars (from the NaCCA curriculum)
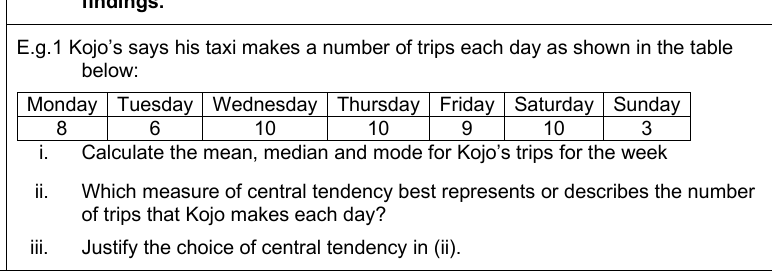
E.g.1 Kojo's says his taxi makes a number of trips each day as shown in the table below:
Monday Tuesday Wednesday Thursday Friday Saturday Sunday
8 6 10 10 9 10 3
i. Calculate the mean, median and mode for Kojo's trips for the week
ii. Which measure of central tendency best represents or describes the number of trips that Kojo makes each day?
iii. Justify the choice of central tendency in (ii).