JHS2 Mathematics · Term 3, Week 10
Data
Lesson notes
Learning Objectives
Indicator: B8.4.1.2.1
By the end of the lesson, learners can:
- Calculate the mean, median, and mode of a given set of ungrouped data.
- Organise ungrouped data into a frequency table to support the calculation of the mode and median.
- Explain, with reasons, why the mean, median, and mode may be the same for one data set and different for another.
- Interpret a bar graph to extract data values and compute the three measures of central tendency.
- Communicate findings clearly, using the correct mathematical language for mean, median, and mode, and justify their answers to peers.
Sign in with your phone number to read the full note and download the GES plan - free.
Sign in with phone numberCurriculum details
- Strand
- Handling Data (Strand 4)
- Sub-strand
- Data (4.1)
- Content standard
- B8.4.1.2 - Demonstrate an understanding of measures of central tendency (mean, median, mode) and range for grouped data and explain when it's most appropriate to use the mean, median, or mode.
- Indicator
- B8.4.1.2.1 - Calculate the mean, median and mode for a given set of ungrouped data, and explain why these values may be the same or different.
- Suggested placement
-
Term 3, Week 10
(Week 34 of the year)
Our suggestion, laid out in curriculum order across three terms of twelve weeks. NaCCA does not fix the week, so follow your school's scheme of learning.
- Curriculum reference
-
Mathematics, Common Core Programme (JHS1-JHS3), 2023, p. 158
Transcribed from the official NaCCA publication. Check this page against the source.
Exemplars (from the NaCCA curriculum)
E.g. 1 The bar graph on the right shows the sales of a small business from Monday to Friday. Calculate the mean, median and mode for amounts collected during the period and explain your findings (i.e. why the values are the same). 350 300
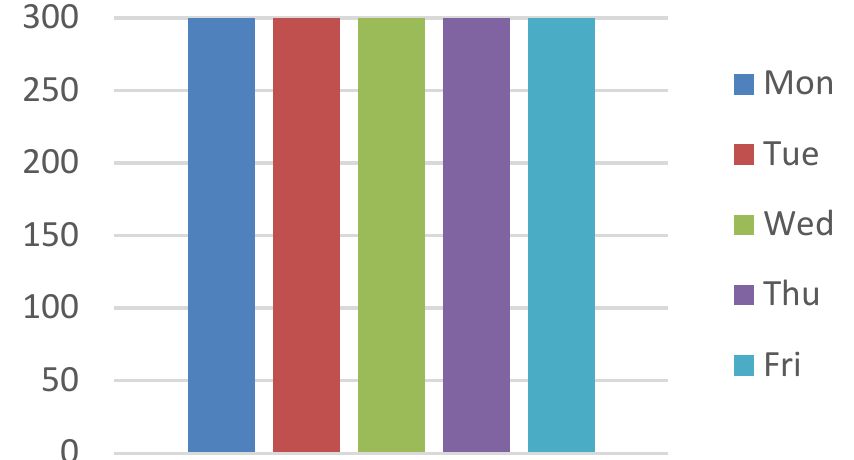
(GH₵) 250 Mon 200 Tue
Collected 150 Wed 100 Thu
Sales 50 Fri 0 1
E. g. 2 The table below shows the area of the sitting room floors of each of 7 real- estate houses (A, B C, …) in Kwashiman
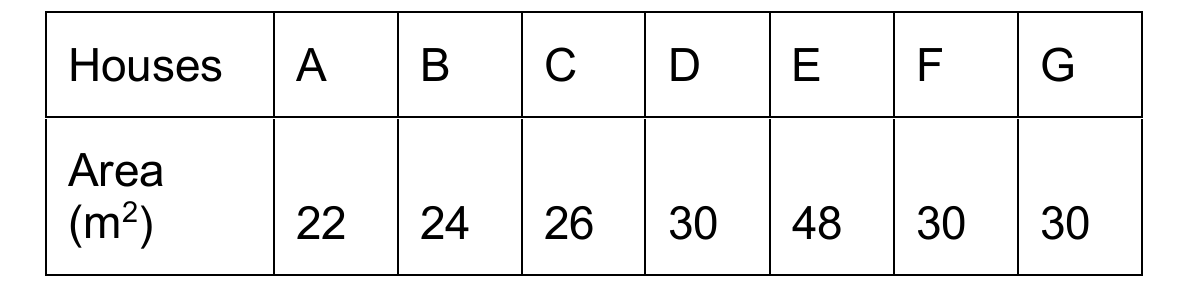
Houses A B C D E F G Area (m 2 ) 22 24 26 30 48 30 30
i. In small groups, work out the mean, median, mode.
ii. Draw a bar chart to represent the data collected, and
iii. Explain why the values are the same.
E.g. 3. The table below shows the occurrence of the data values from 1 to 7 and is represented by the corresponding bar graph.
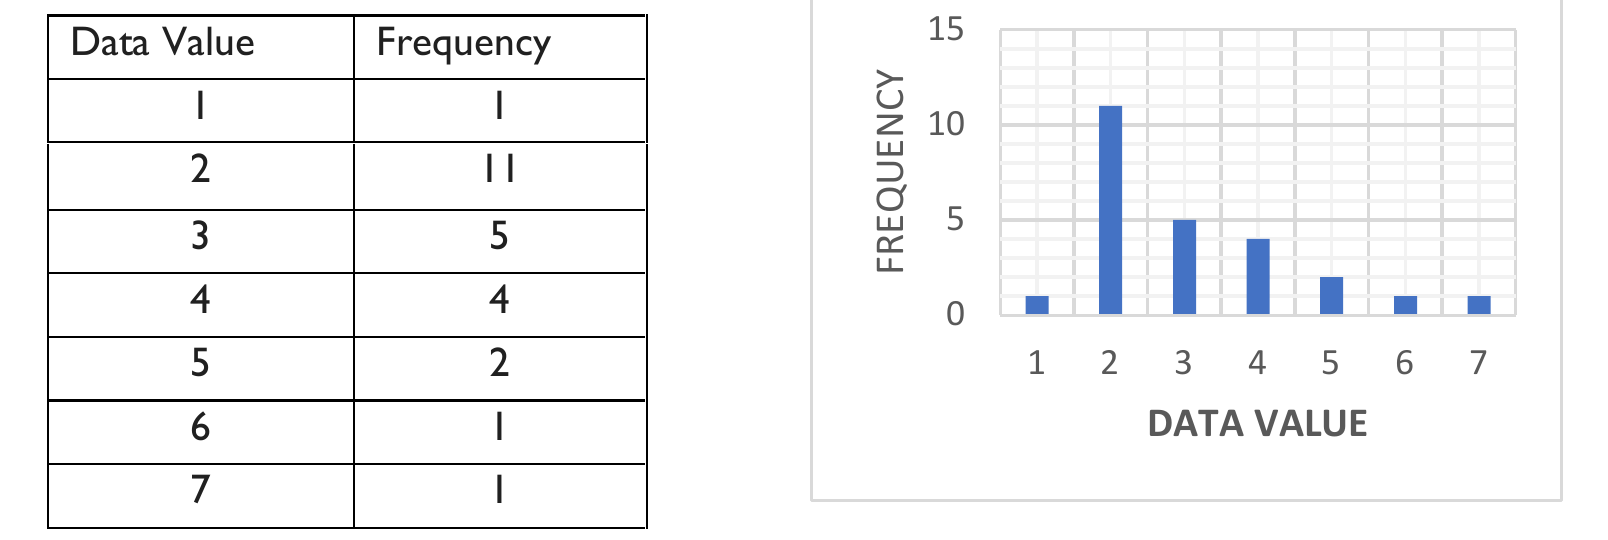
Data Value Frequency 15 1 1 FREQUENCY 10 2 11 5
3 5
4 4 0
5 2 1 2 3 4 5 6 7
6 1 DATA VALUE 7 1
i. Calculate the mean, median, mode.
ii. Locate them on the corresponding graph.
iii. Explain why the values are different.