JHS1 Mathematics · Term 3, Week 9
Data
Lesson notes
Learning Objectives
Indicator: B7.4.1.1.2 - Design and administer a questionnaire for collecting data to answer questions and record the results.
By the end of the lesson, learners can:
- State the purpose of a questionnaire and when it is an appropriate tool for collecting data.
- Identify the qualities of a well-designed questionnaire, including clear questions, simple language, and a mix of open and closed questions.
- Design a questionnaire with at least five relevant questions to answer a given research question.
- Administer the questionnaire to collect real data from classmates and record the responses accurately.
- Evaluate their own and others’ questionnaires and suggest at least one improvement.
Sign in with your phone number to read the full note and download the GES plan - free.
Sign in with phone numberCurriculum details
- Strand
- Handling Data (Strand 4)
- Sub-strand
- Data (4.1)
- Content standard
- B7.4.1.1 - Select, justify, and use appropriate methods to collect data (quantitative and qualitative), display and analyse the data (grouped/ungrouped) presented in frequency tables, line graphs, pie graphs, bar graphs or pictographs and use these to solve and/or pose problems.
- Indicator
- B7.4.1.1.2 - Design and administer a questionnaire for collecting data to answer questions and record the results.
- Suggested placement
-
Term 3, Week 9
(Week 33 of the year)
Our suggestion, laid out in curriculum order across three terms of twelve weeks. NaCCA does not fix the week, so follow your school's scheme of learning.
- Curriculum reference
-
Mathematics, Common Core Programme (JHS1-JHS3), 2023, p. 78
Transcribed from the official NaCCA publication. Check this page against the source.
Exemplars (from the NaCCA curriculum)
E.g. 1. Conduct a survey (within a small group of learners) by producing a question form (such as the one below) and collecting real information. Class Survey Question Form
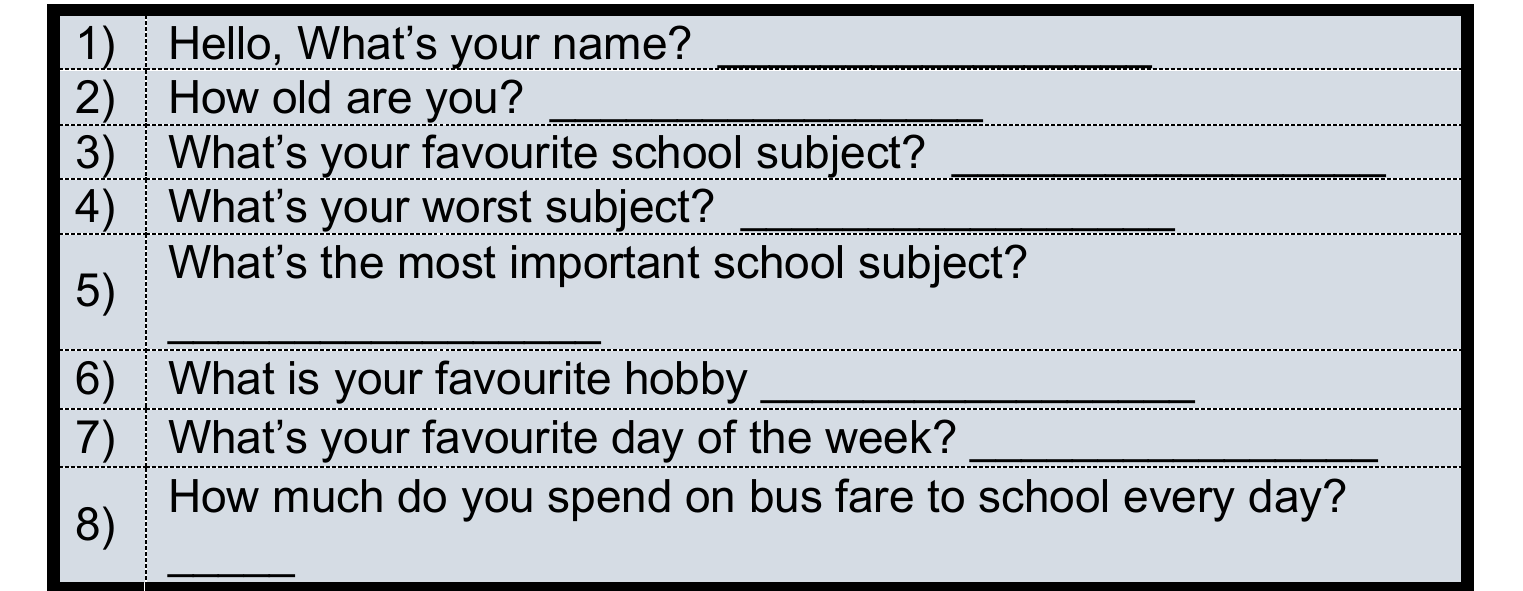
1) Hello, What's your name? _________________ 2) How old are you? _________________ 3) What's your favourite school subject? _________________ 4) What's your worst subject? _________________ What's the most important school subject?
5) _________________
6) What is your favourite hobby _________________ 7) What's your favourite day of the week? ________________ How much do you spend on bus fare to school every day?
8) _____
E.g. 2. Use a table (like the one below) to organise the data obtained with the question form (or questionnaire).
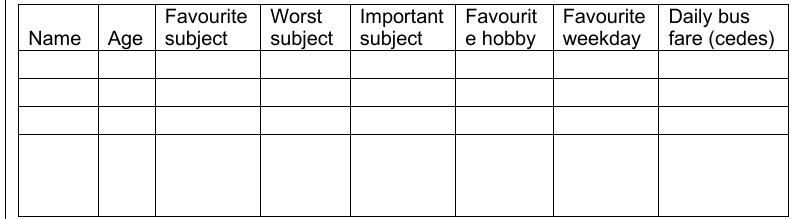
Favourite Worst Important Favourit Favourite Daily bus
Name Age subject subject subject e hobby weekday fare (cedes)