B6 Mathematics · Term 3, Week 9
Data Collection, Organization, Presentation, Interpretation and Analysis
Lesson notes
Learning Objectives
Indicator: B6.4.1.2.2
By the end of the lesson, learners can:
- Design a questionnaire with clear, well-worded questions to collect data that answers a given question.
- Administer the questionnaire to a target group (classmates) in an organised and respectful manner.
- Record the results obtained from the questionnaire accurately in a tally table.
- Identify and correct common problems in questionnaire items, such as vague wording or missing response options.
- Work collaboratively in small groups to design, administer, and record a questionnaire, showing attention to precision in every step.
Sign in with your phone number to read the full note and download the GES plan - free.
Sign in with phone numberCurriculum details
- Strand
- Data (Strand 4)
- Sub-strand
- Data Collection, Organization, Presentation, Interpretation and Analysis (4.1)
- Content standard
- B6.4.1.2 - Select, justify, and use appropriate methods of collecting data, including questionnaires, interview, observation, experiments, databases, electronic media, etc.
- Indicator
- B6.4.1.2.2 - Design and administer a questionnaire for collecting data to answer a given question and record the results
- Suggested placement
-
Term 3, Week 9
(Week 33 of the year)
Our suggestion, laid out in curriculum order across three terms of twelve weeks. NaCCA does not fix the week, so follow your school's scheme of learning.
- Source document note
-
The official curriculum document has a fault in this entry, so the curriculum text above is transcribed exactly as printed:
- exemplars - p.155
- Curriculum reference
-
Mathematics Curriculum for Primary Schools (Basic 4-6), 2019, p. 155
Transcribed from the official NaCCA publication. Check this page against the source.
Exemplars (from the NaCCA curriculum)
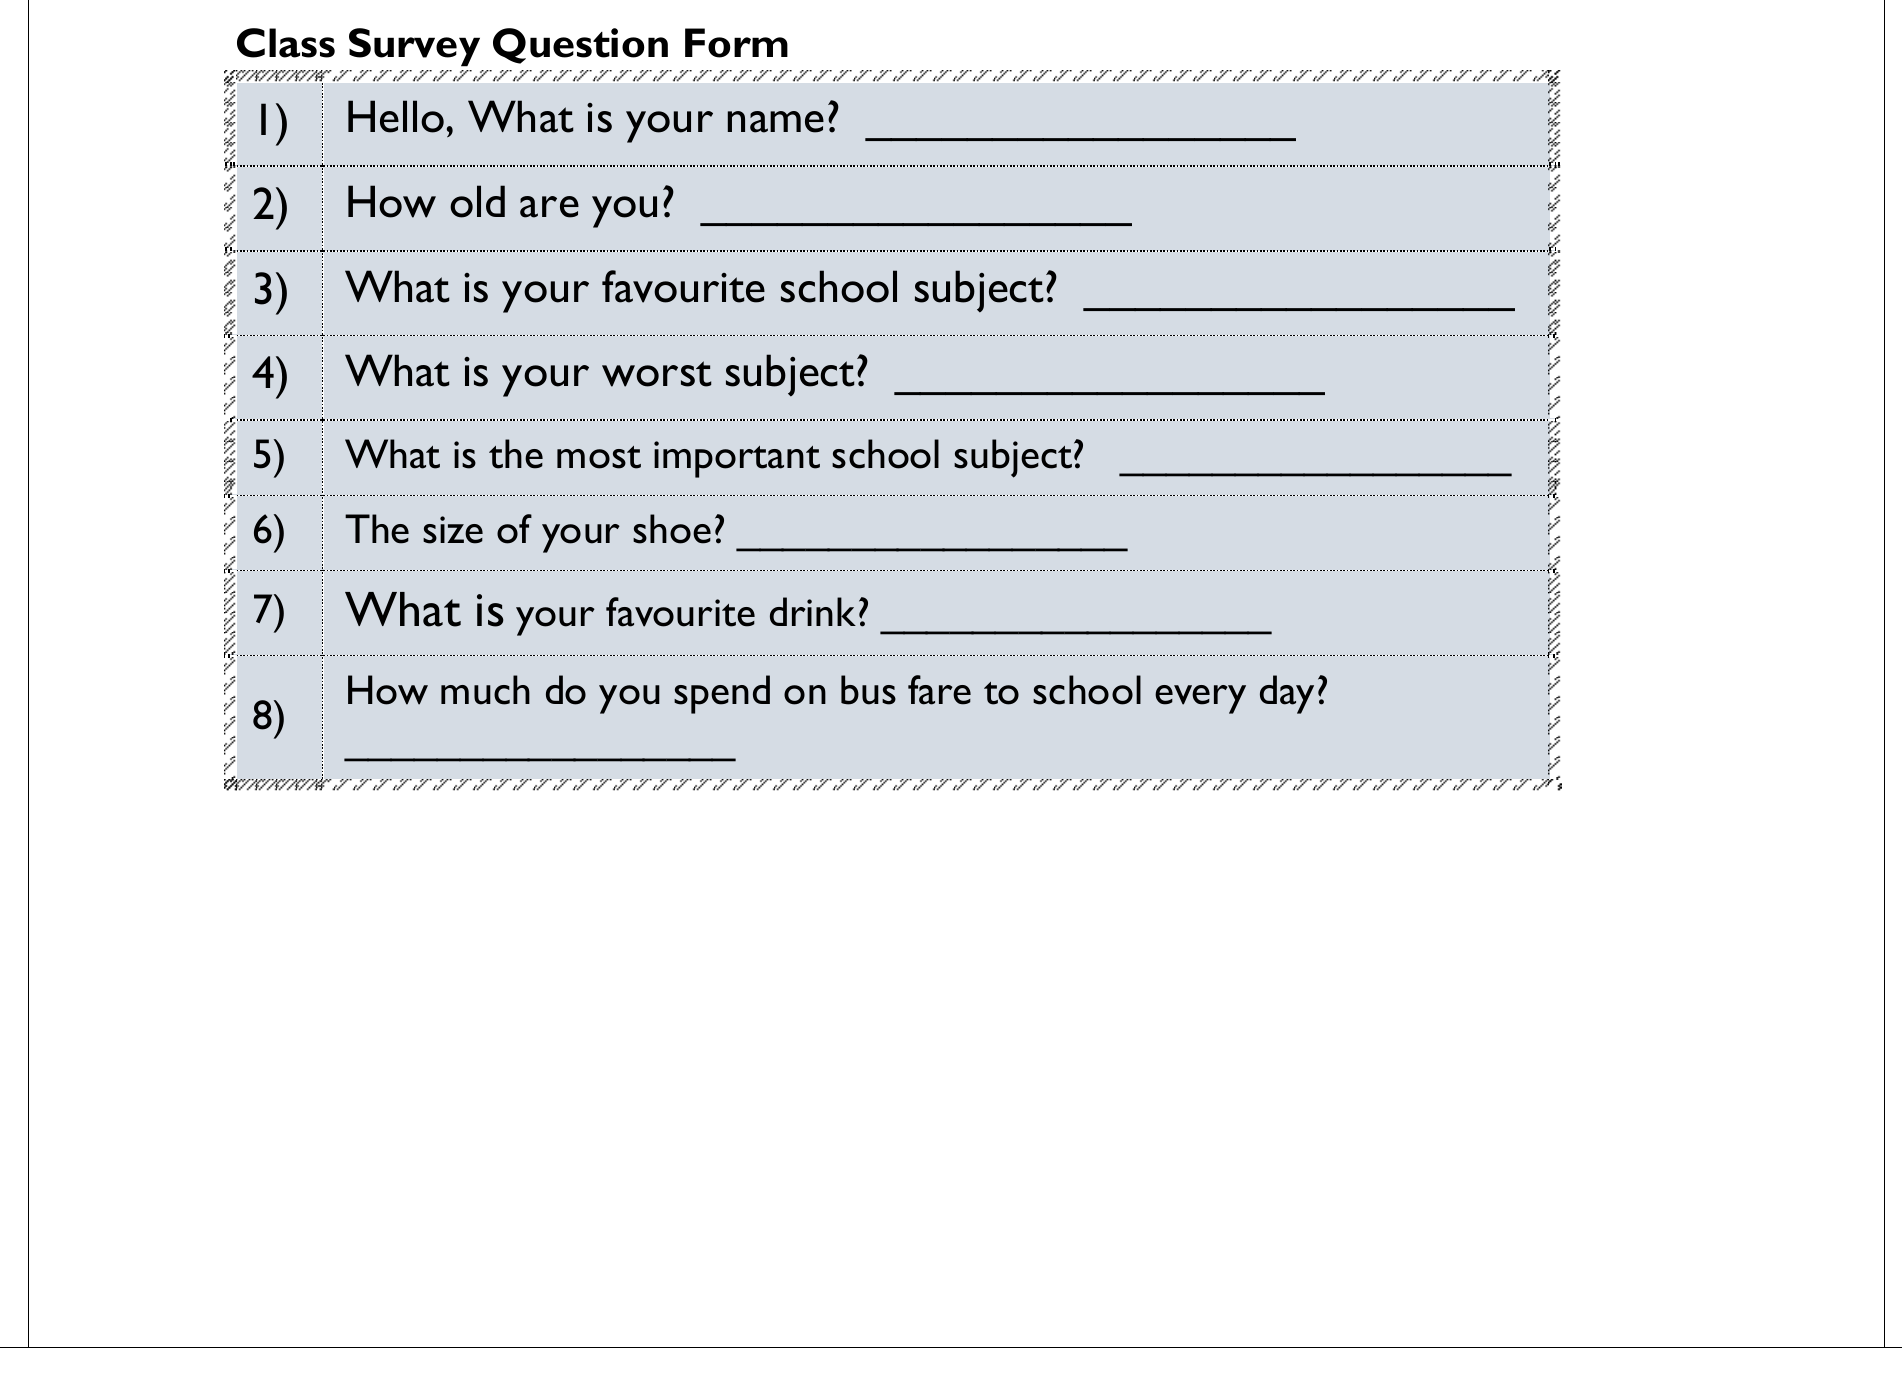
E.g. 1. Guide learners (in small groups) to do surveys; as surveys are useful ways of getting them to interact, produce question forms and collect real information. Ask them to use Question Form below for collecting the class data
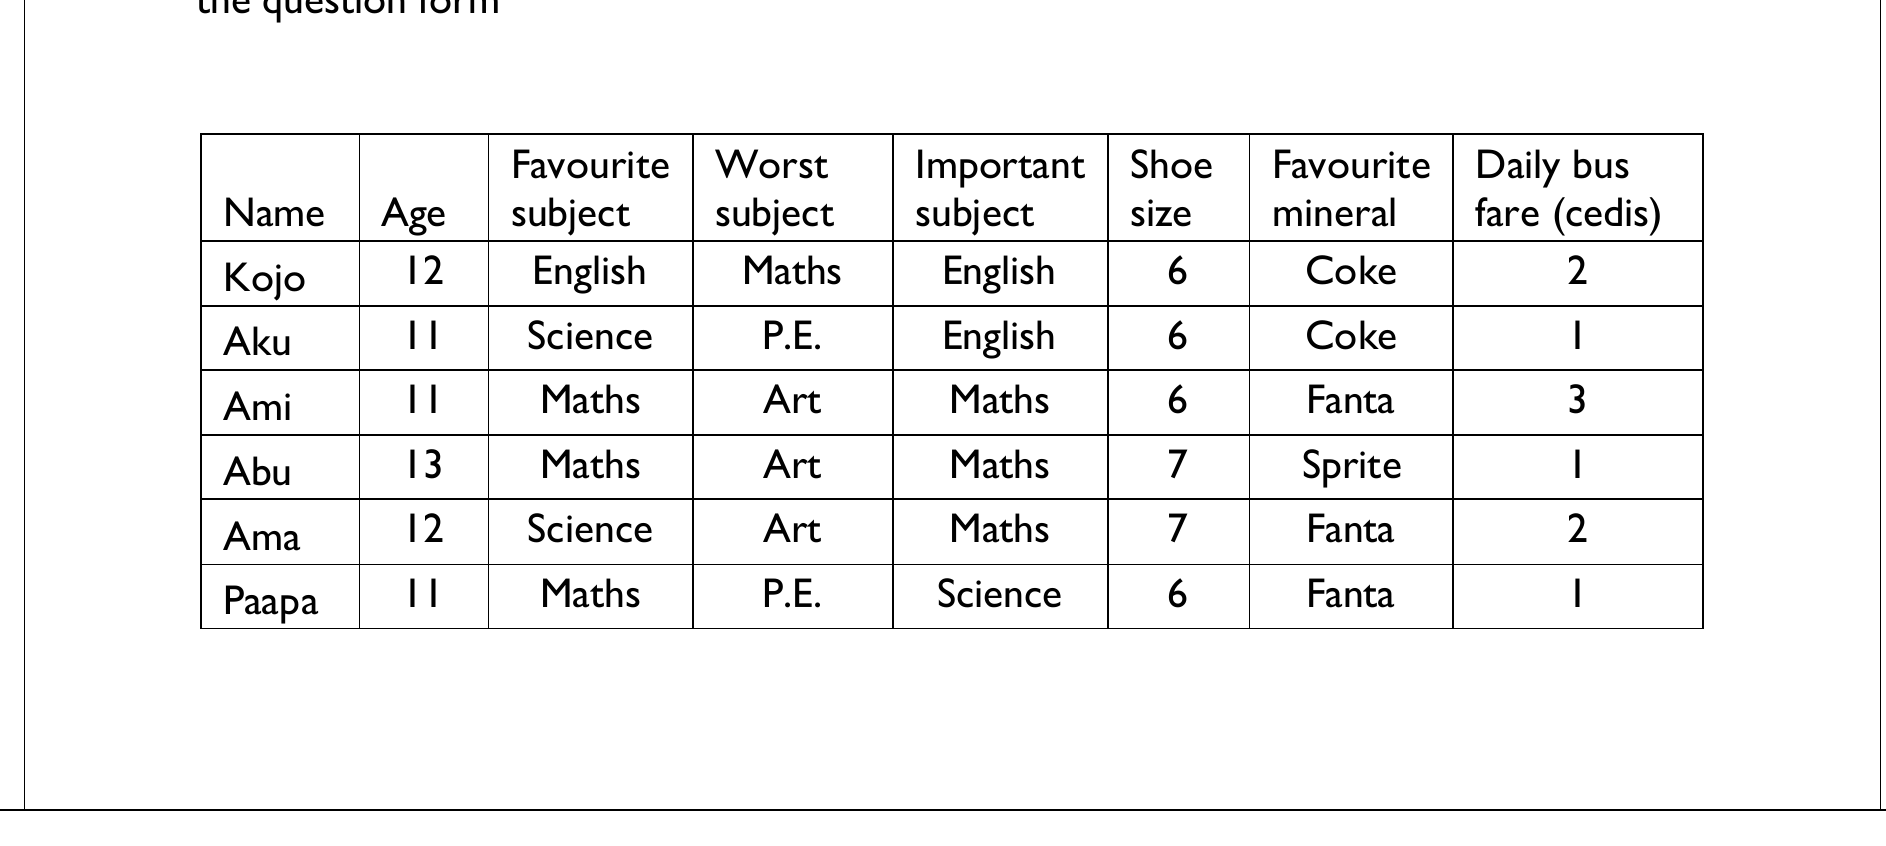
E.g. 2. Guide learners in each group to use a table (like the one below) to organize the data obtained with the question form
The document prints this indicator's code as "B6.5.2.2" - four segments, and a strand 5 that does not exist in the Mathematics curriculum. It sits between B6.4.1.2.1 (printed p.154) and B6.4.1.2.3 (printed p.157) under content standard B6.4.1.2, and printed p.157 refers back to it as "P6.5.2.2.3 above". It is written here as B6.4.1.2.2, the code its own position requires; a reviewer must confirm the printed code and decide. INVENTORY.md does not count it, because a four-segment code does not match an indicator pattern.