B4 Mathematics · Term 3, Week 11
Data Collection, Organization, Presentation, Interpretation and Analysis
Lesson notes
Learning Objectives
Indicator: B4.4.1.1.4 - Find examples of graphs in which many-to-one correspondence is used in print and electronic media, such as newspapers, magazines and the Internet, and describe the correspondence used
By the end of the lesson, learners can:
- Look at graphs from newspapers, magazines, or the Internet and identify whether they use many-to-one correspondence.
- Describe the correspondence used in a given graph by stating what one symbol or one unit on the scale represents (for example, 1 picture = 10 pupils).
- Explain why many-to-one correspondence is used for large numbers in real graphs.
- Answer questions by reading and interpreting graphs that use many-to-one correspondence.
- Justify their answers by pointing to the key or scale on the graph they read.
This builds directly on the one-to-one correspondence work from Week 9 and the many-to-one graphing from Week 10. Later lessons will focus on drawing your own graphs and solving problems, so today we focus on finding and describing graphs from real media.
Sign in with your phone number to read the full note and download the GES plan - free.
Sign in with phone numberCurriculum details
- Strand
- Data (Strand 4)
- Sub-strand
- Data Collection, Organization, Presentation, Interpretation and Analysis (4.1)
- Content standard
- B4.4.1.1 - Demonstrate an understanding of many-to-one correspondence in displaying, and reading or interpreting, graphs
- Indicator
- B4.4.1.1.4 - Find examples of graphs in which many-to-one correspondence is used in print and electronic media, such as newspapers, magazines and the Internet, and describe the correspondence used
- Suggested placement
-
Term 3, Week 11
(Week 35 of the year)
Our suggestion, laid out in curriculum order across three terms of twelve weeks. NaCCA does not fix the week, so follow your school's scheme of learning.
- Curriculum reference
-
Mathematics Curriculum for Primary Schools (Basic 4-6), 2019, p. 51
Transcribed from the official NaCCA publication. Check this page against the source.
Exemplars (from the NaCCA curriculum)
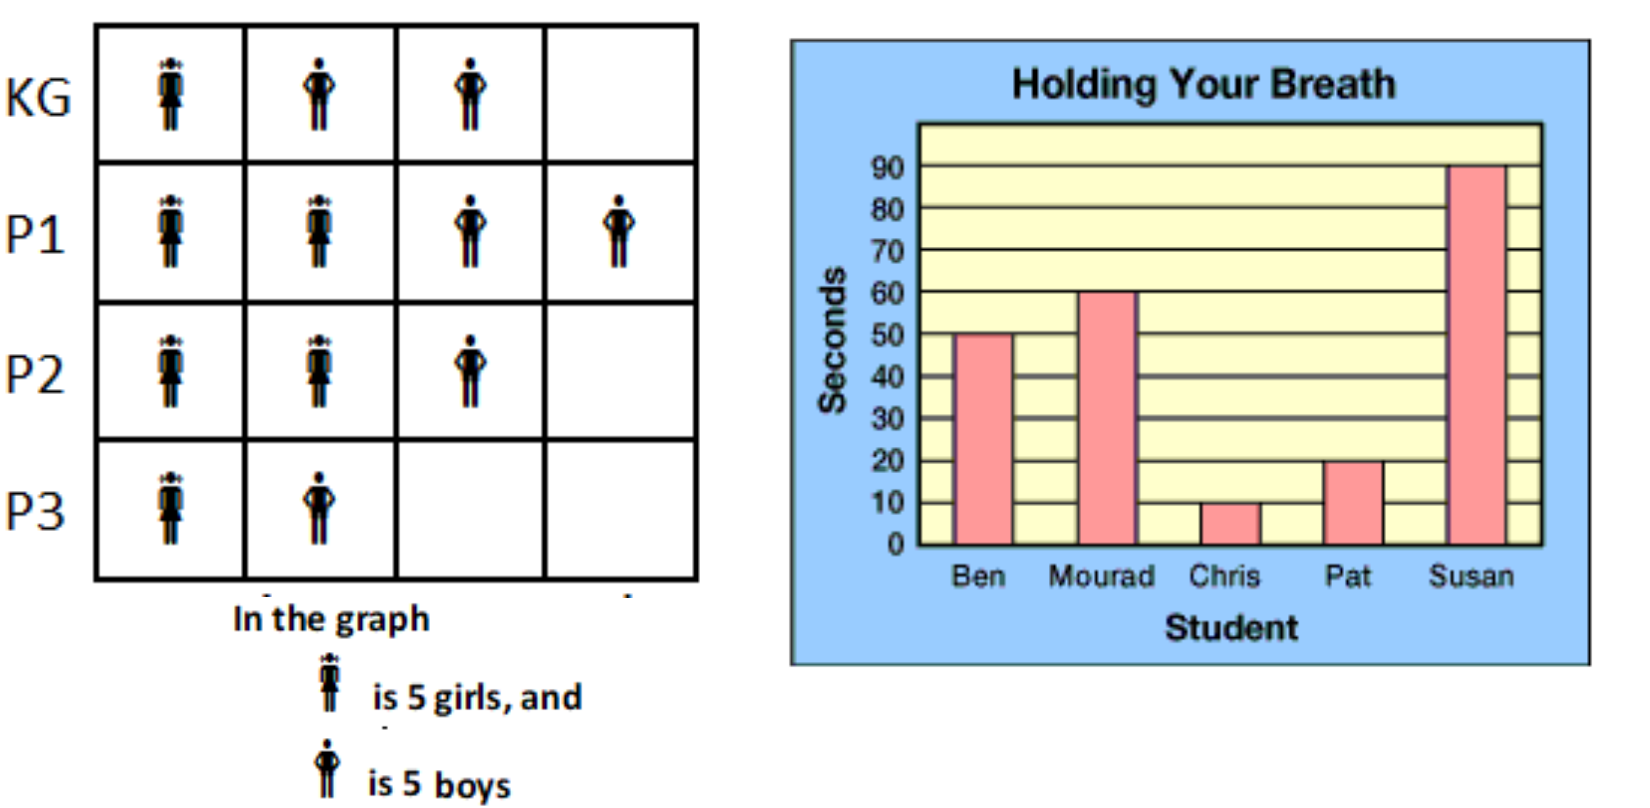
E.g. 1. Give learners several graphs that have used many-to-one correspondence in displaying the same data. E.g. The graphs below show the number of pupils in a KG to P3 in a school and the time five pupils can take to hold their breath. Ask questions for children to read and interpret graphs How many pupils are in KG and P1? How many pupils more pupils are in P1 than P3? How long did Ben hold his breath? Who can hold her breath longest? Etc.