B4 Mathematics · Term 3, Week 12
Data Collection, Organization, Presentation, Interpretation and Analysis
Lesson notes
Learning Objectives
Indicator: B4.4.1.2.2 - Use understanding of many-to-one correspondence to solve simple problems (how many altogether, comparing, or take apart problems) requiring interpretation of many-to-one bar graphs (up to 4 categories of data).
By the end of the lesson, learners can:
- Read values from a many-to-one bar graph where one bar or symbol represents more than one item, using the key to find the value of each bar.
- Solve “how many altogether” problems by finding the total for two or more categories shown on a many-to-one bar graph.
- Solve comparing problems by finding the difference between two categories shown on a many-to-one bar graph.
- Solve take apart problems by identifying how many are in one category when the total and another category are known.
- Explain their reasoning clearly, showing how they used the key and the scale to arrive at each answer.
Sign in with your phone number to read the full note and download the GES plan - free.
Sign in with phone numberCurriculum details
- Strand
- Data (Strand 4)
- Sub-strand
- Data Collection, Organization, Presentation, Interpretation and Analysis (4.1)
- Content standard
- B4.4.1.2 - Construct and interpret pictographs and bar graphs involving many-to-one correspondence to draw conclusions.
- Indicator
- B4.4.1.2.2 - Use understanding of many-to-one correspondence to solve simple problems (how many altogether, comparing, or take apart problems) requiring interpretation of many-to- one bar graphs (up to 4 categories of data).
- Suggested placement
-
Term 3, Week 12
(Week 36 of the year)
Our suggestion, laid out in curriculum order across three terms of twelve weeks. NaCCA does not fix the week, so follow your school's scheme of learning.
- Curriculum reference
-
Mathematics Curriculum for Primary Schools (Basic 4-6), 2019, p. 53
Transcribed from the official NaCCA publication. Check this page against the source.
Exemplars (from the NaCCA curriculum)
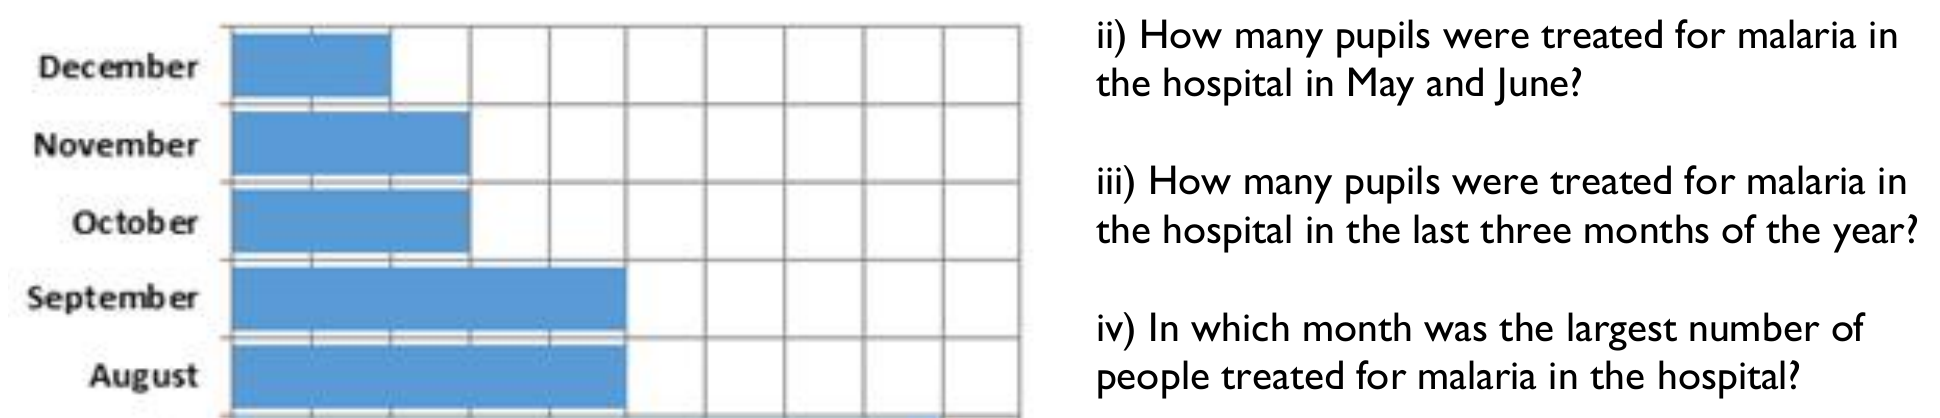
E.g. 1. Give learners several graphs that have used many-to-one correspondence in displaying the same data. For example, the graph below on the number of pupils treated for malaria in a school. Ask questions for children to read and interpret graphs. i) How many pupils were treated for malaria in the hospital in April? ii) How many pupils were treated for malaria in the hospital in May and June? iii) How many pupils were treated for malaria in the hospital in the last three months of the year? iv) In which month was the largest number of people treated for malaria in the hospital?