B4 Mathematics · Term 3, Week 9
Data Collection, Organization, Presentation, Interpretation and Analysis
Full lesson notes coming
Notes for this lesson are being prepared. The curriculum details below are complete and ready to use for your planning.
Curriculum details
- Strand
- Data (Strand 4)
- Sub-strand
- Data Collection, Organization, Presentation, Interpretation and Analysis (4.1)
- Content standard
- B4.4.1.1 - Demonstrate an understanding of many-to-one correspondence in displaying, and reading or interpreting, graphs
- Indicator
- B4.4.1.1.1 - Use an understanding of one-to-one correspondence to read and interpret graphs
- Suggested placement
-
Term 3, Week 9
(Week 33 of the year)
Our suggestion, laid out in curriculum order across three terms of twelve weeks. NaCCA does not fix the week, so follow your school's scheme of learning.
- Curriculum reference
-
Mathematics Curriculum for Primary Schools (Basic 4-6), 2019, p. 47
Transcribed from the official NaCCA publication. Check this page against the source.
Exemplars (from the NaCCA curriculum)
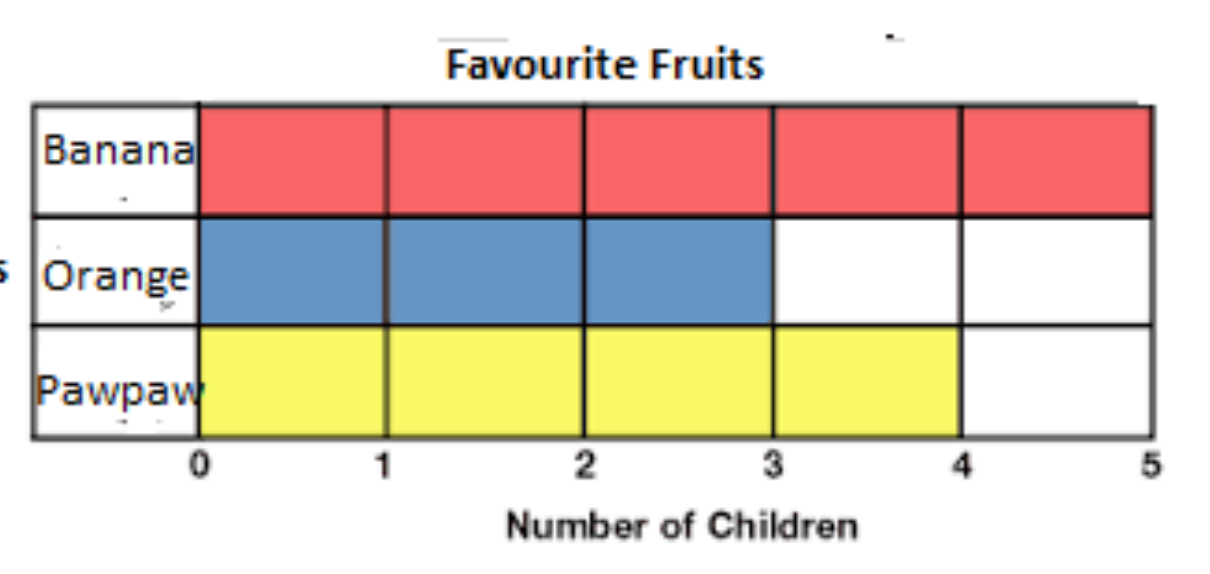
E.g. 1. Give learners graphs that use one-to-one correspondence in displaying data. For example, the graph below shows the favourite fruits of children in a P4 class. Each coloured box in the graph represents a pupil Ask the following questions for children to read and interpret graphs i. How many pupils said they like pawpaw? ii. What is the most favourite food of the class? How many pupils are in the class? Etc.