B5 Mathematics · Term 3, Week 9
Data Collection, Organisation, Presentation, Interpretation and Analysis
Lesson notes
Learning Objectives
Indicator: B5.4.1.1.2 - Find examples of second-hand data in print and electronic media, such as newspapers, magazines, and the internet.
By the end of the lesson, learners can:
- Identify second-hand data in newspapers, magazines, and on the internet by pointing out the source and the data presented.
- Explain why data found in print and electronic media is classified as second-hand data.
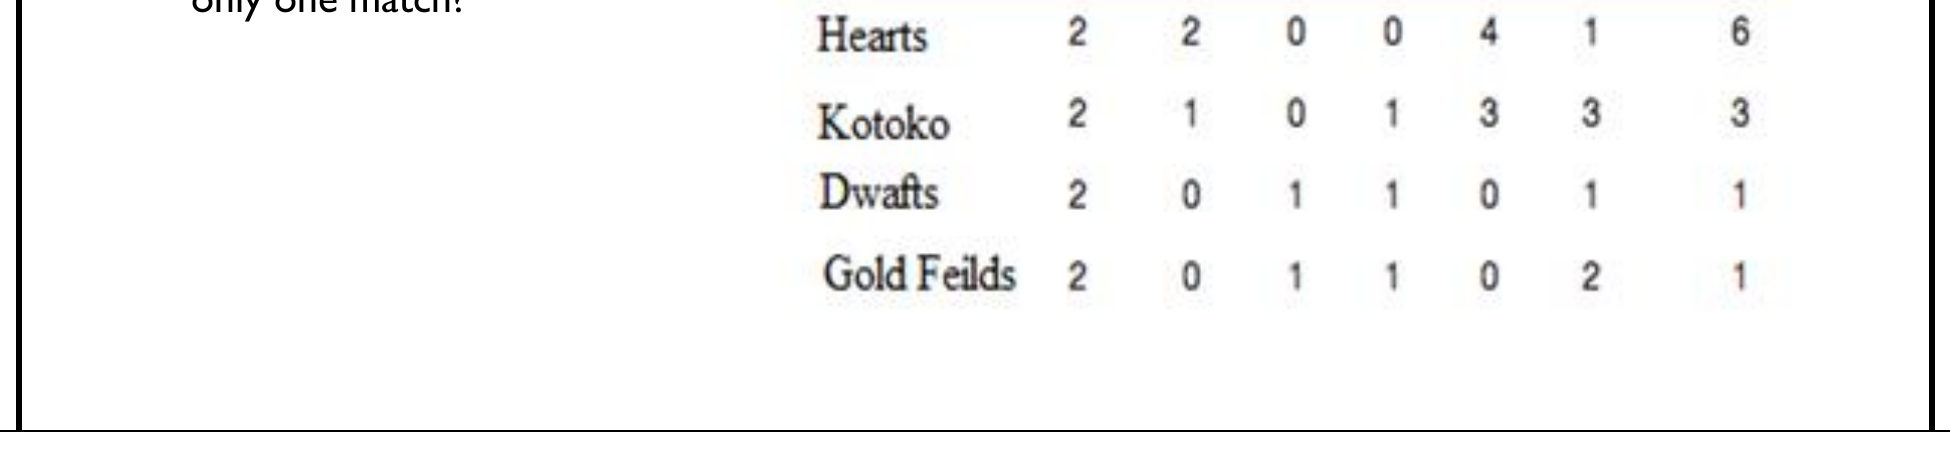
- Read and interpret a football league table by answering questions such as which team has not lost a match and which team has won only one match.
- Write at least three original questions based on a given set of second-hand data for a friend to answer.
- Distinguish between first-hand data (data they collect themselves) and second-hand data (data someone else collected and published), using examples from Ghanaian media.
Sign in with your phone number to read the full note and download the GES plan - free.
Sign in with phone numberCurriculum details
- Strand
- Data (Strand 4)
- Sub-strand
- Data Collection, Organisation, Presentation, Interpretation and Analysis (4.1)
- Content standard
- B5.4.1.1 - Differentiate between first-hand and second- hand data
- Indicator
- B5.4.1.1.2 - Find examples of second-hand data in print and electronic media, such as newspapers, magazines, and the internet.
- Suggested placement
-
Term 3, Week 9
(Week 33 of the year)
Our suggestion, laid out in curriculum order across three terms of twelve weeks. NaCCA does not fix the week, so follow your school's scheme of learning.
- Curriculum reference
-
Mathematics Curriculum for Primary Schools (Basic 4-6), 2019, p. 107
Transcribed from the official NaCCA publication. Check this page against the source.
Exemplars (from the NaCCA curriculum)
E.g. 1. Look for examples of second-hand data in the newspaper or website; You can find data on league table, price list, sales, rainfall, etc.
E.g. 2. Ask learners to study the second-hand data on the league table and write questions for their friends to read and interpret the data. E.g. Which team has not lost in a match? Which team has won only one match?
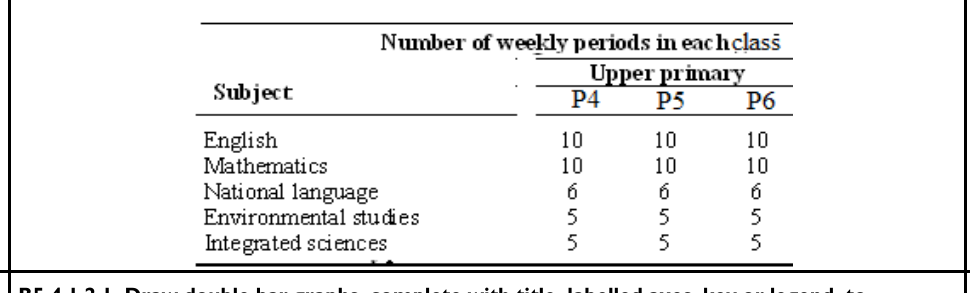
E.g. 3. Ask learners to study the second-hand data on suggested number of 30 minutes periods that Ghanaian primary school children learn certain subjects every week. Ask them to write questions for their friends to read and interpret the data.