B5 Mathematics · Term 3, Week 10
Data Collection, Organisation, Presentation, Interpretation and Analysis
Lesson notes
Learning Objectives
Indicator: B5.4.1.2.1 - Draw double bar graphs, complete with title, labelled axes, key or legend, to represent data collected (up to 3 pairs of categories of data and use it to solve problems.
By the end of the lesson, learners can:
- Identify the components of a double bar graph, including the title, labelled axes, and key or legend.
- Draw a double bar graph from a table of paired data (up to 3 pairs of categories) with a title, labelled axes, and a key.
- Read and interpret data from a double bar graph to answer questions.
- Solve simple problems by comparing two sets of data presented in a double bar graph.
- Justify their conclusions by referring to specific bars or values in the graph.
Sign in with your phone number to read the full note and download the GES plan - free.
Sign in with phone numberCurriculum details
- Strand
- Data (Strand 4)
- Sub-strand
- Data Collection, Organisation, Presentation, Interpretation and Analysis (4.1)
- Content standard
- B5.4.1.2 - Construct and interpret double bar graphs to draw conclusions
- Indicator
- B5.4.1.2.1 - Draw double bar graphs, complete with title, labelled axes, key or legend, to represent data collected (up to 3 pairs of categories of data and use it to solve problems.
- Suggested placement
-
Term 3, Week 10
(Week 34 of the year)
Our suggestion, laid out in curriculum order across three terms of twelve weeks. NaCCA does not fix the week, so follow your school's scheme of learning.
- Curriculum reference
-
Mathematics Curriculum for Primary Schools (Basic 4-6), 2019, p. 108
Transcribed from the official NaCCA publication. Check this page against the source.
Exemplars (from the NaCCA curriculum)
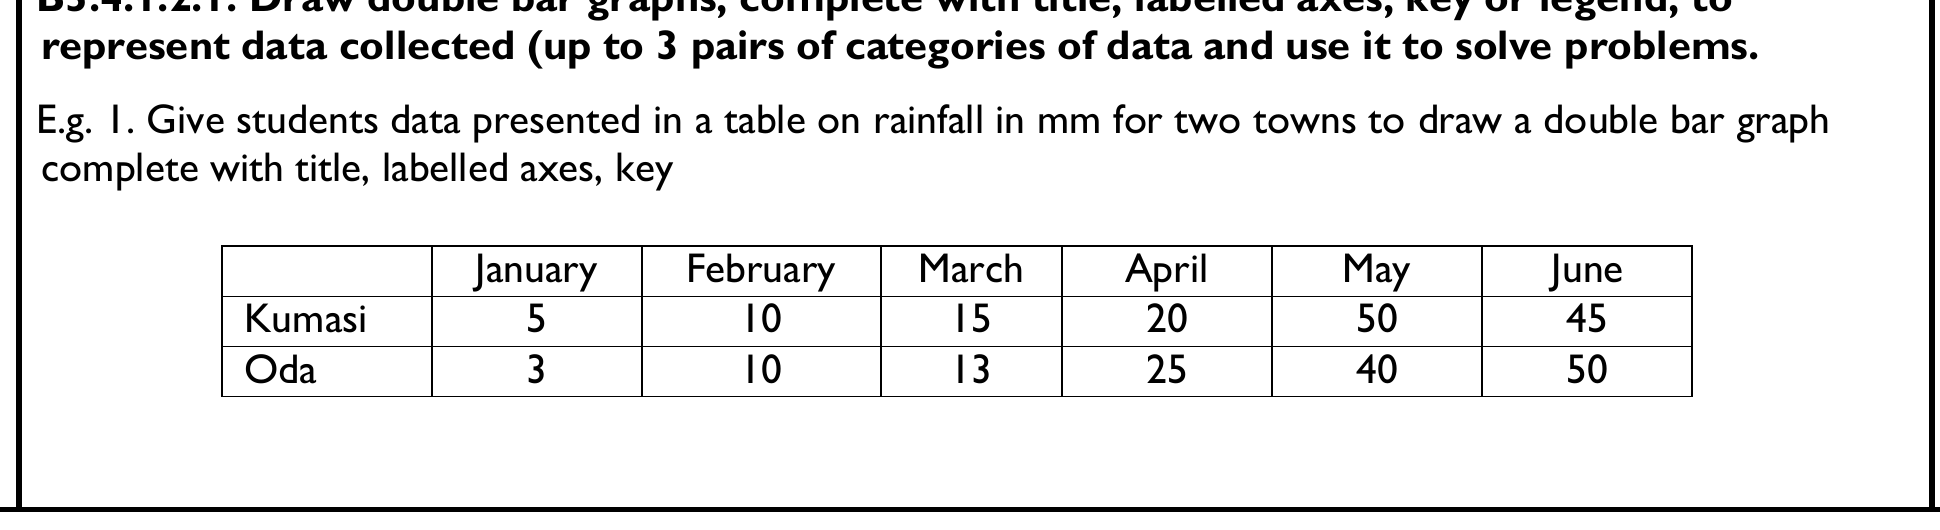
E.g. 1. Give students data presented in a table on rainfall in mm for two towns to draw a double bar graph complete with title, labelled axes, key January February March April May June Kumasi 5 10 15 20 50 45 Oda 3 10 13 25 40 50
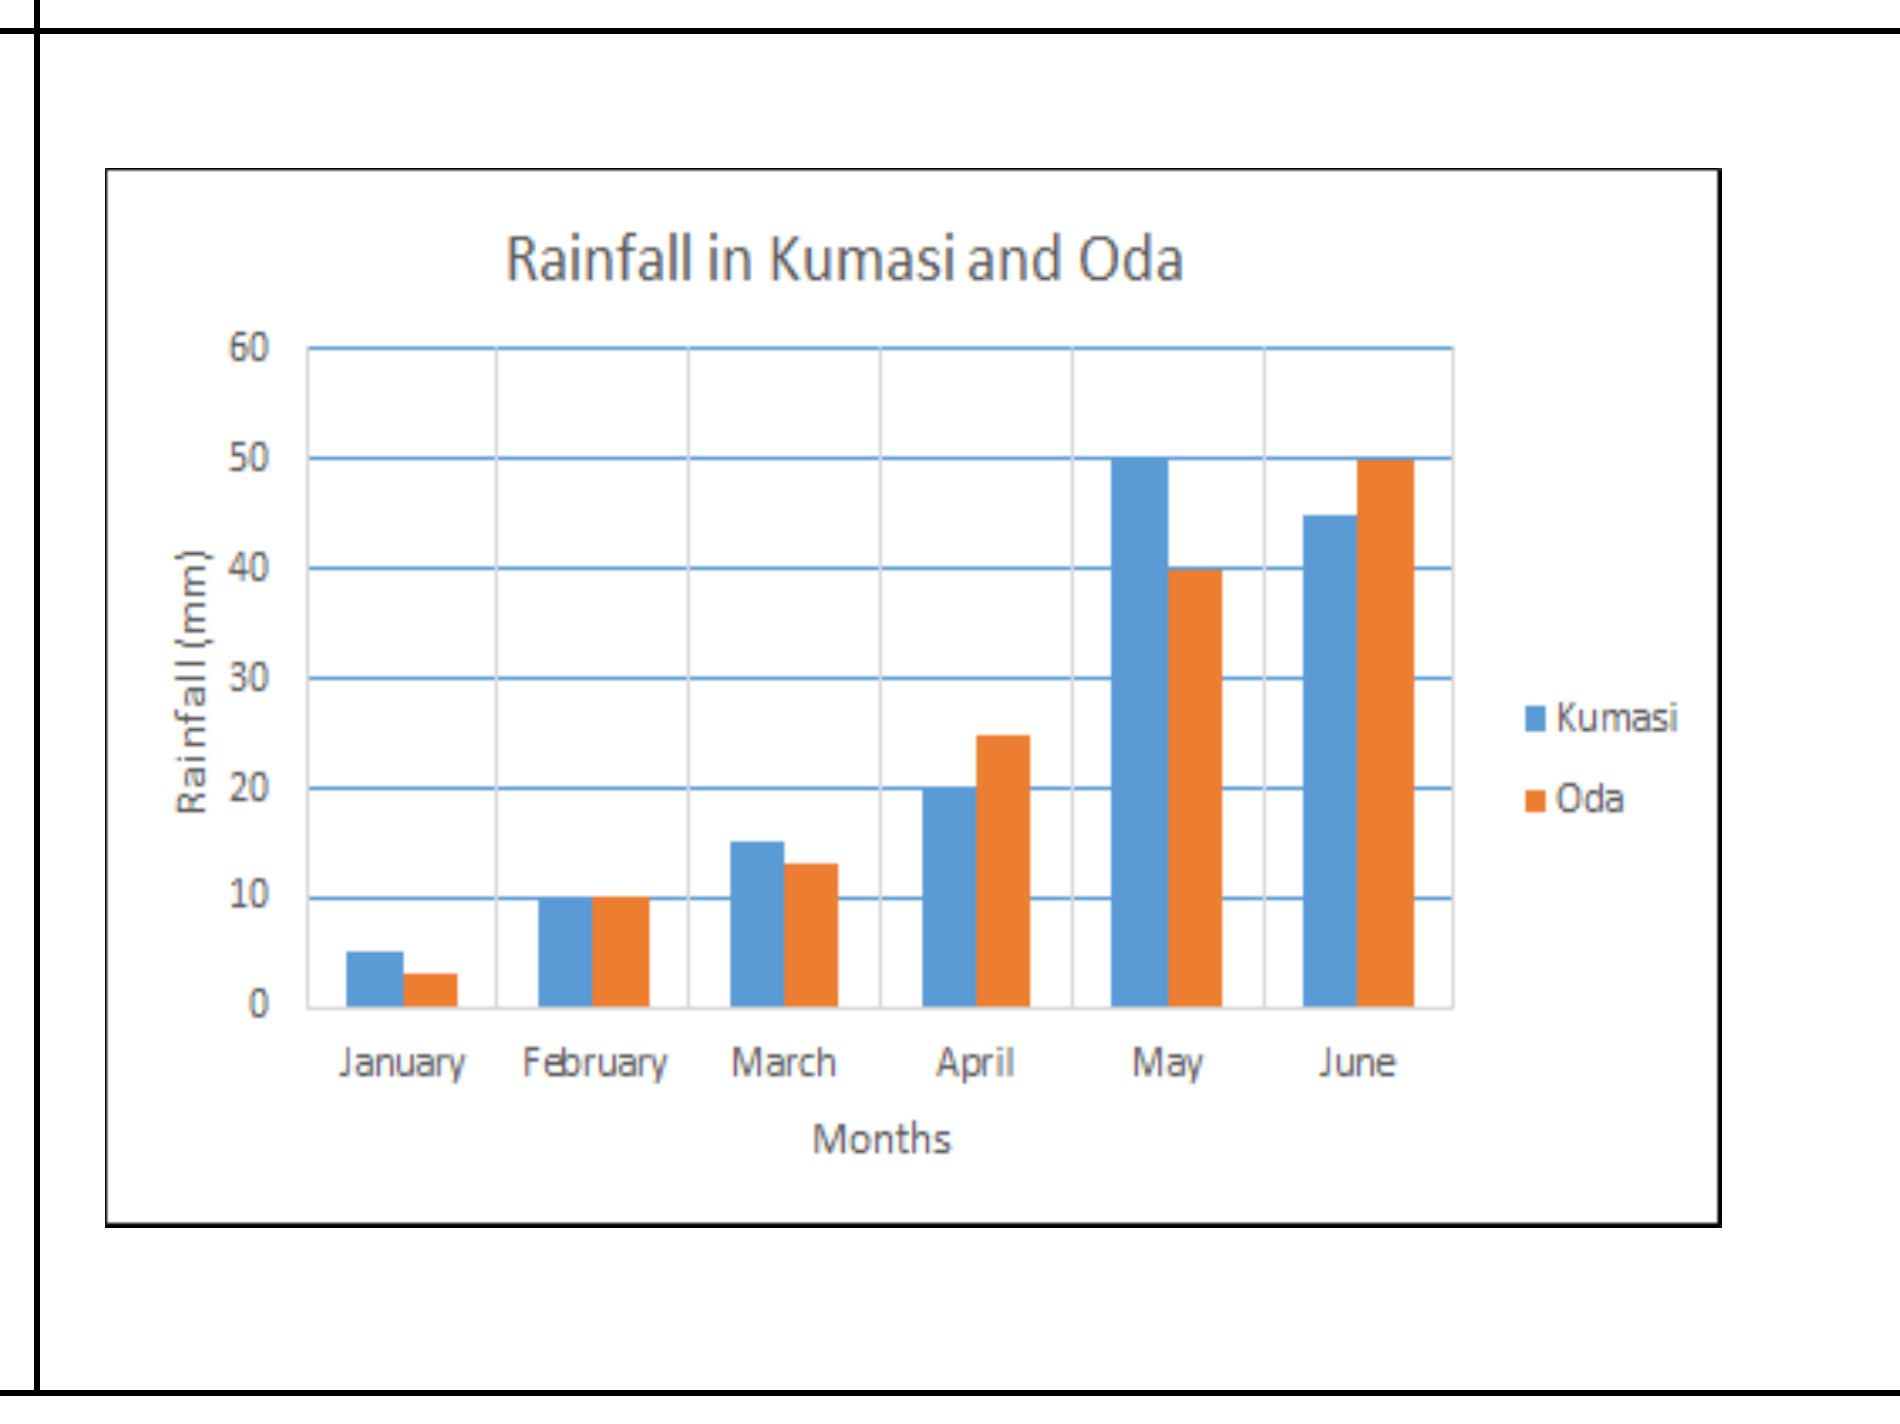
E.g. 2. Give students more paired data presented in a tables. Ask them to study the paired data in the tables and ask them questions based on them. Also ask them to write questions for their friends to read and interpret the data. For instance some questions can be (i) In which subject was Fusena's worse performance? (ii) How many pupils are in the upper primary classes in Presby? (iii) When was the best day for Senasco shop?
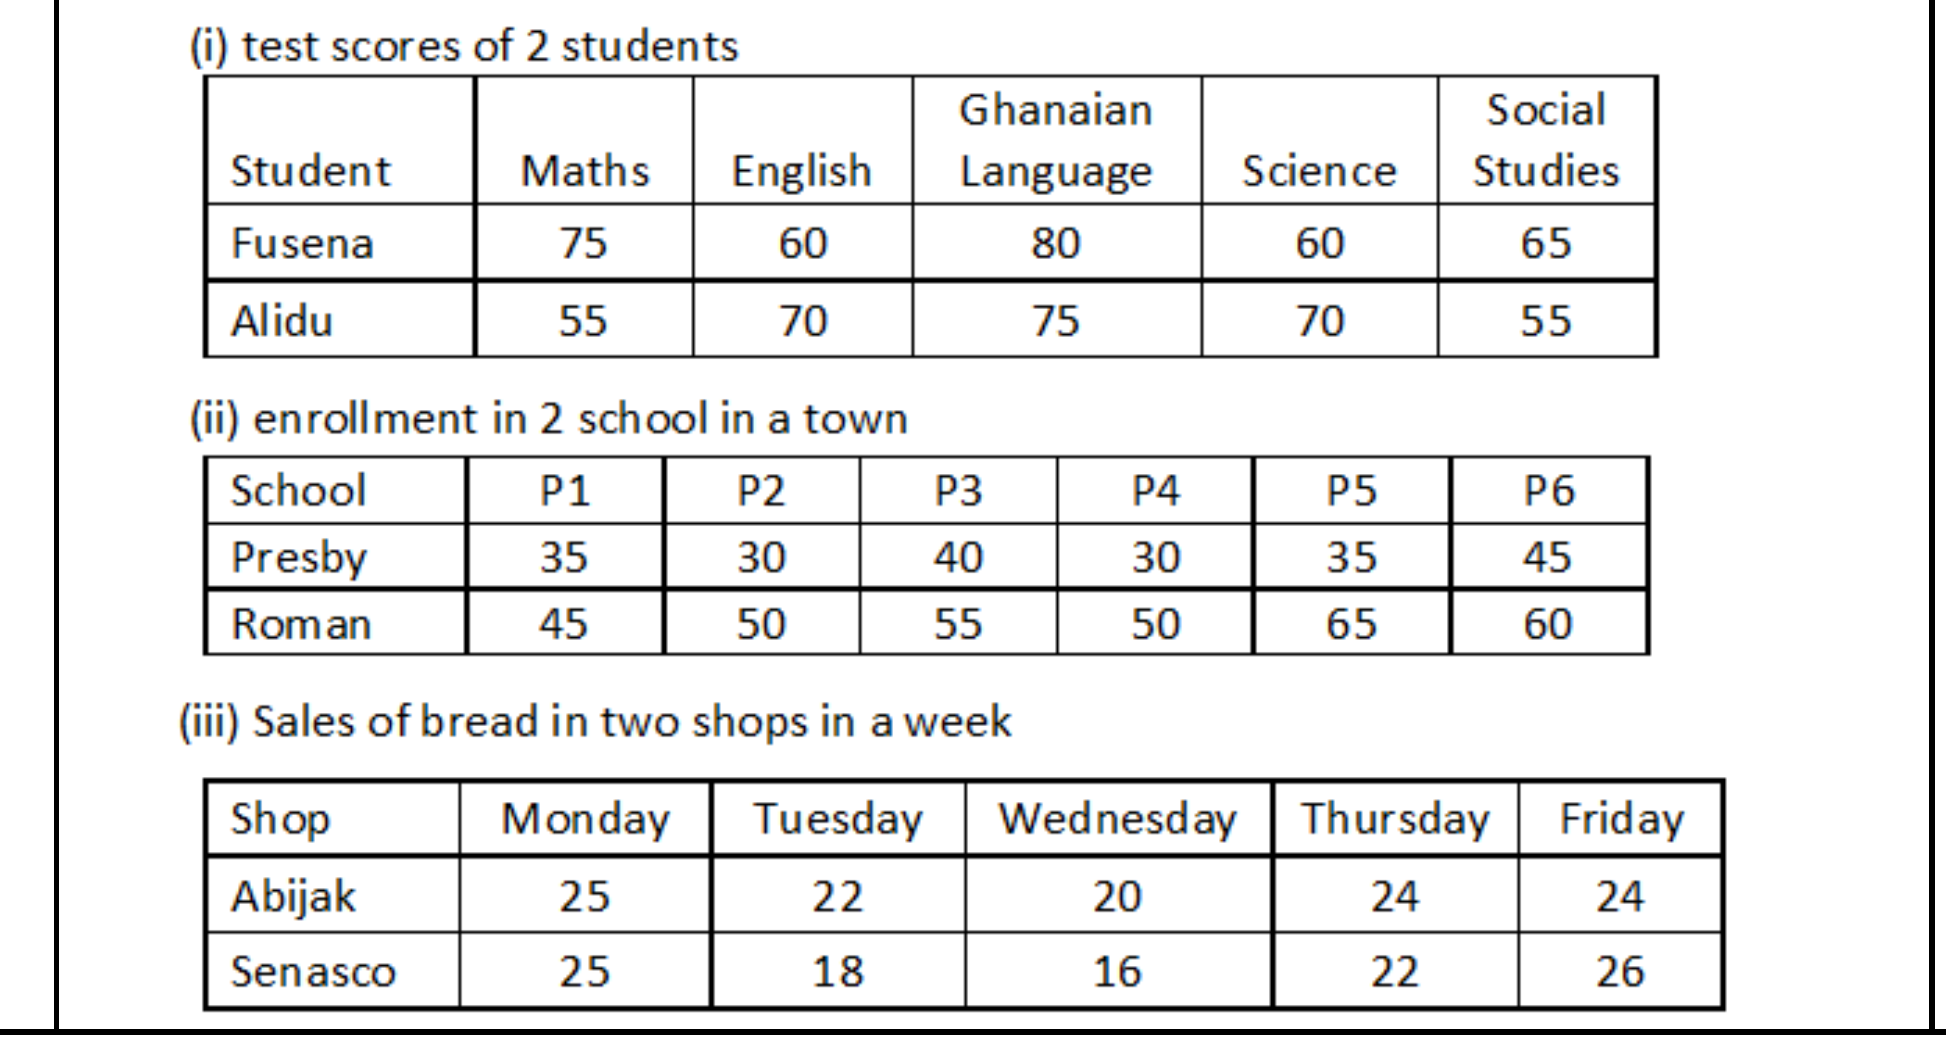
E.g. 3. Ask learners to draw double bar graphs complete with title, labelled axes, key for the paired data presented in the tables on (i) percentage test scores of 2 students; (ii) enrolment in 2 schools in a town; sales of two of bread in two shops in a week; etc.