JHS2 Mathematics · Term 3, Week 12
Chance or Probability
Lesson notes
Learning Objectives
Indicator: B8.4.2.1.2 - Express the probabilities of the events as fractions, decimals, percentages and/or ratios. e.g.by using a tree diagram, table or other graphic organiser.
By the end of the lesson, learners can:
- Express the probability of an event from a two-stage experiment as a fraction in its simplest form.
- Convert probability fractions to decimals and percentages accurately.
- State probabilities as ratios in the form “a:b” where appropriate.
- Complete a probability tree diagram for two independent events and read probabilities from its branches.
- Solve simple problems that require converting between fractions, decimals, percentages and ratios when reporting probabilities.
Sign in with your phone number to read the full note and download the GES plan - free.
Sign in with phone numberCurriculum details
- Strand
- Handling Data (Strand 4)
- Sub-strand
- Chance or Probability (4.2)
- Content standard
- B8.4.2.1 - Identify the sample space for a probability experiment involving two independent events and express the probabilities of given events as fractions, decimals, percentages and/or ratios to solve problems.
- Indicator
- B8.4.2.1.2 - Express the probabilities of the events as fractions, decimals, percentages and/or ratios. e.g.by using a tree diagram, table or other graphic organiser.
- Suggested placement
-
Term 3, Week 12
(Week 36 of the year)
Our suggestion, laid out in curriculum order across three terms of twelve weeks. NaCCA does not fix the week, so follow your school's scheme of learning.
- Curriculum reference
-
Mathematics, Common Core Programme (JHS1-JHS3), 2023, p. 162
Transcribed from the official NaCCA publication. Check this page against the source.
Exemplars (from the NaCCA curriculum)
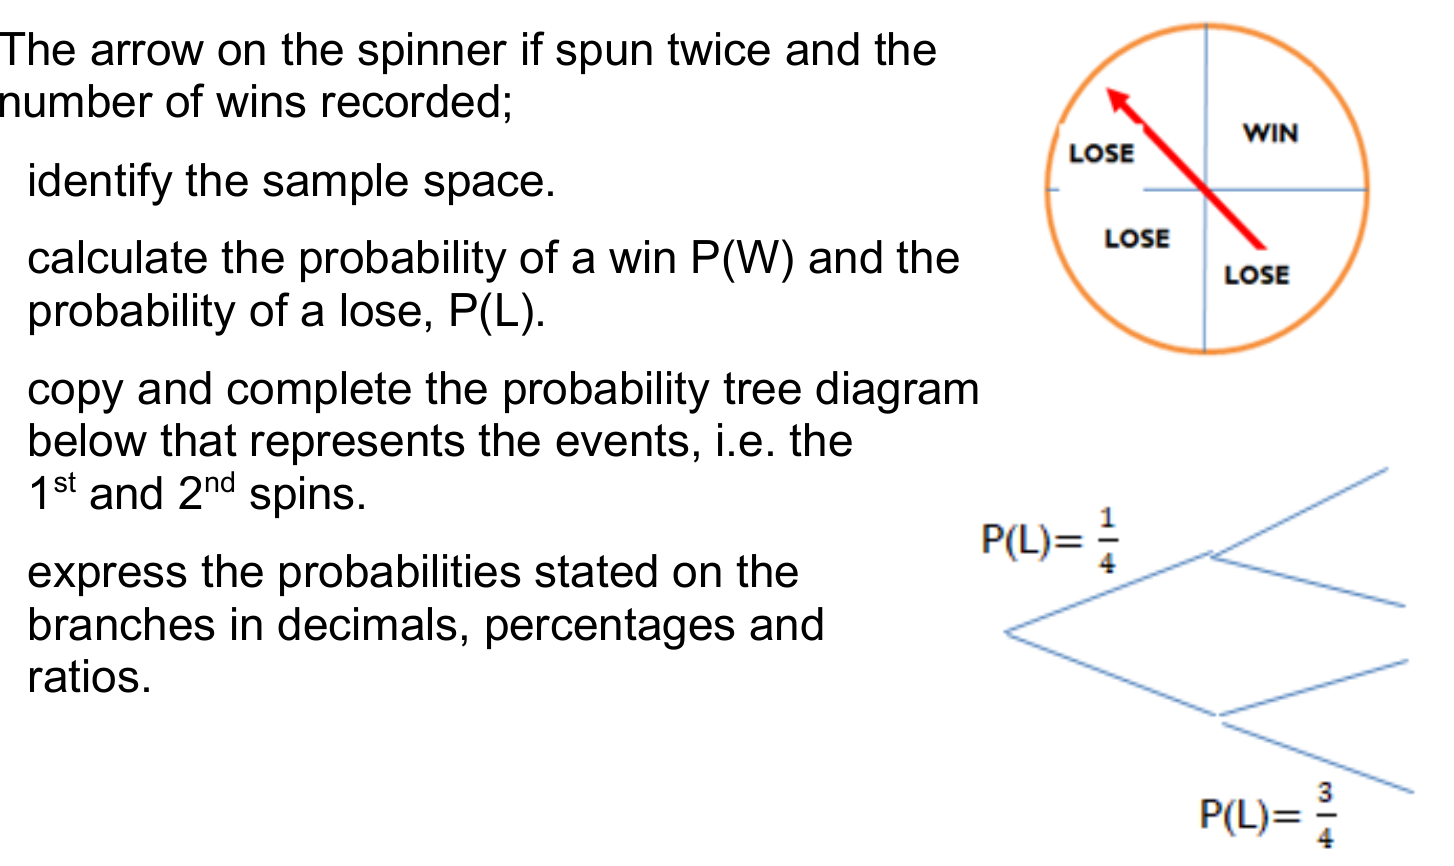
E.g. 1The arrow on the spinner if spun twice and the number of wins recorded;
i. identify the sample space.
ii. calculate the probability of a win P(W) and the probability of a lose, P(L).
iii. copy and complete the probability tree diagram below that represents the events, i.e. the 1 st and 2 nd spins.
iv. express the probabilities stated on the branches in decimals, percentages and ratios.
E.g. 2-A box contains 3 blue pens and 4 pink pens. A pen is taken from the box, its colour noted, and then replaced. Another pen is taken and its colour noted.
i. What is the sample space of the 1 st and the 2 nd trials?
ii. Draw a probability tree diagram to represent the event.
E.g. 2 A die is thrown at most three times. If 6 is scored the game stops.
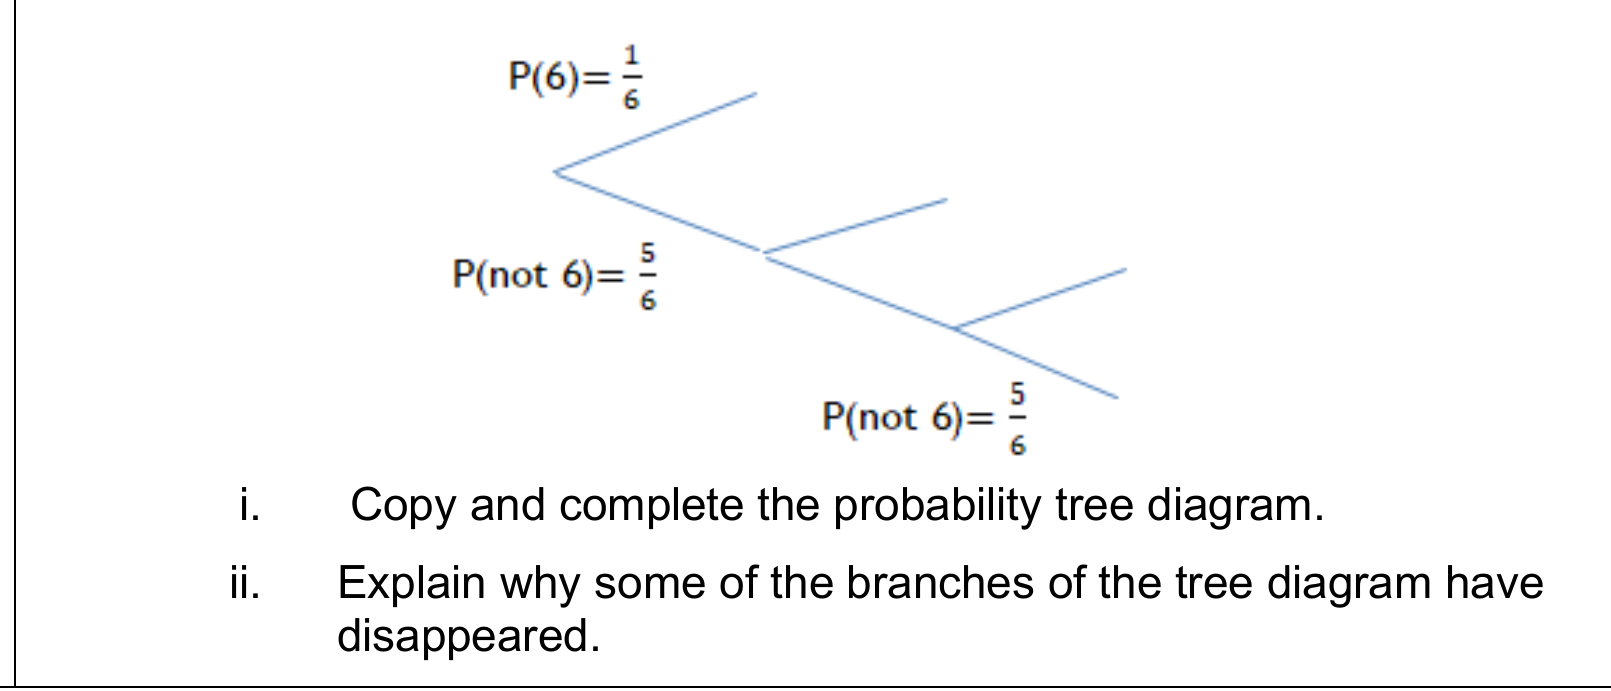
i. Copy and complete the probability tree diagram.
ii. Explain why some of the branches of the tree diagram have disappeared.