B6 Mathematics · Term 3, Week 11
Chance or Probability
Lesson notes
Learning Objectives
Indicator: B6.4.2.2.1
By the end of the lesson, learners can:
- List all possible outcomes of a probability experiment such as tossing a coin, rolling a die, or spinning a spinner with a given number of sectors
- Determine the theoretical probability of an outcome by using the formula: number of favourable outcomes divided by total number of outcomes
- Conduct a simple probability experiment (tossing a coin or rolling a die) and record results using tallies and frequency tables
- Express probabilities as fractions, decimals, and percentages
- Explain the meaning of theoretical probability as what we expect to happen before an experiment is carried out
Sign in with your phone number to read the full note and download the GES plan - free.
Sign in with phone numberCurriculum details
- Strand
- Data (Strand 4)
- Sub-strand
- Chance or Probability (4.2)
- Content standard
- B6.4.2.2 - Demonstrate an understanding of probability by identifying all possible outcomes of a probability experiment, determining the theoretical and experimental probability of outcomes in a probability experiment
- Indicator
- B6.4.2.2.1 - List the possible outcomes of a probability experiment, such as tossing a coin, rolling a die with a given number of sides, spinning a spinner with a given number of sectors and determine the theoretical probability of an outcome occurring for a given probability experiment
- Suggested placement
-
Term 3, Week 11
(Week 35 of the year)
Our suggestion, laid out in curriculum order across three terms of twelve weeks. NaCCA does not fix the week, so follow your school's scheme of learning.
- Curriculum reference
-
Mathematics Curriculum for Primary Schools (Basic 4-6), 2019, p. 158
Transcribed from the official NaCCA publication. Check this page against the source.
Exemplars (from the NaCCA curriculum)
E.g. 1. Through discussion guide learners to understand that theoretical probability is what we expect to happen, where experimental probability is what actually happens when we try it out. The both probabilities are calculated the same way, using the number of possible ways an outcome can occur divided by the total number of outcomes
E.g. 2. Guide learners (in each small group) to carry out the following experiments 100 times, use tallies to record their results, and transfer it to frequency tables: (i) tossing a coin 100 times; (ii) throwing a dice 100 times
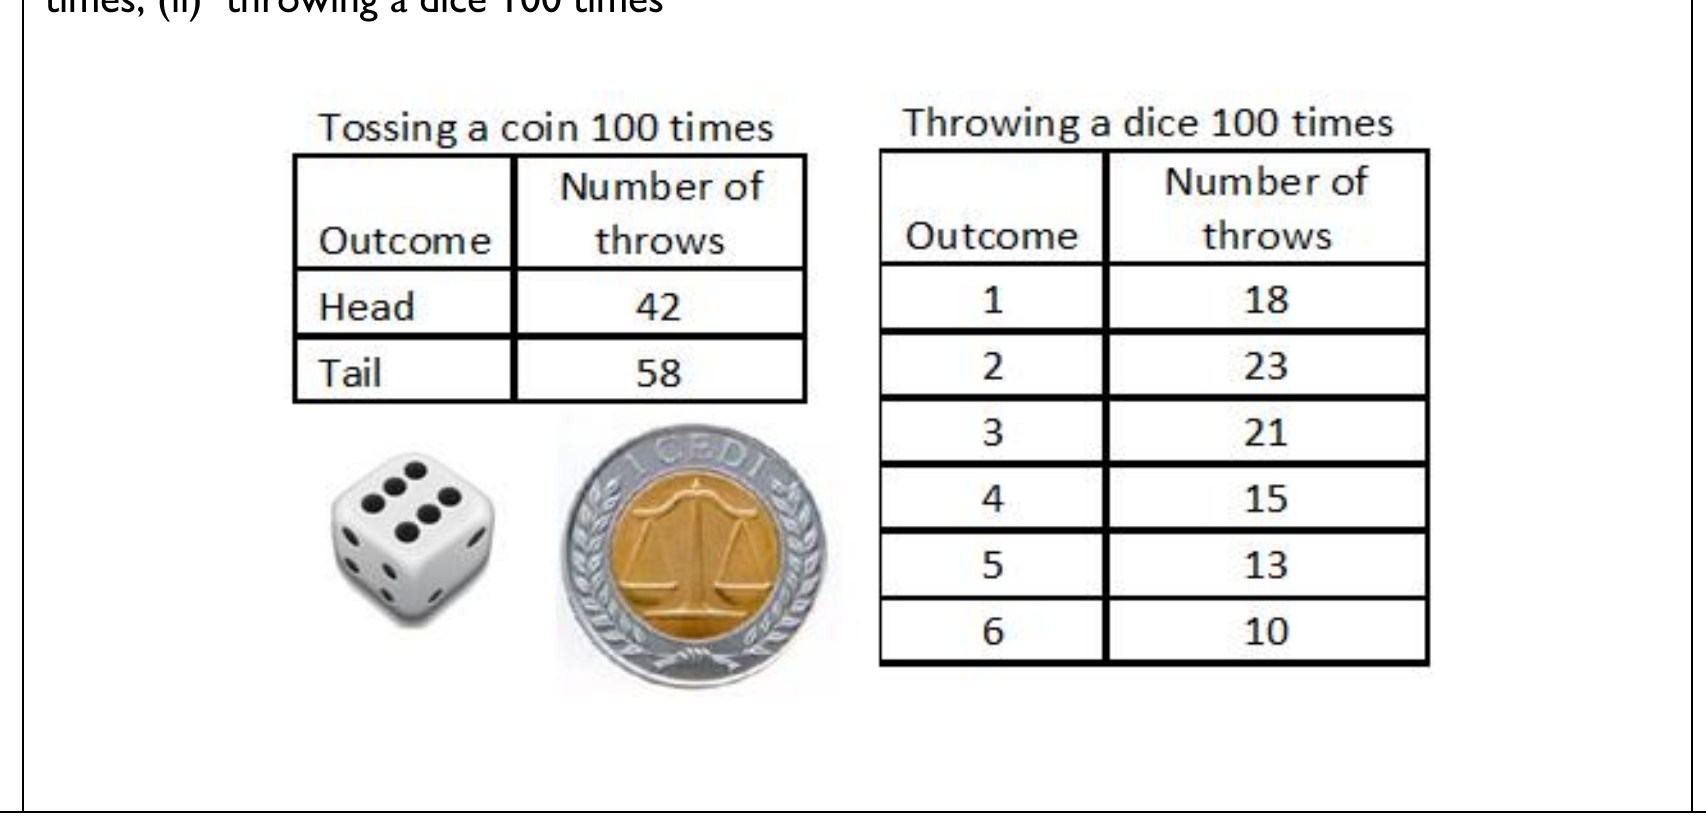
E.g. 3 Guide learners (in each small group) to use the results of the experiments above (recorded in the tables above) to work out the experimental probability and compare to the theoretical probability. E.g. the experiment probability of a head showing up out of the hundred outcomes is given by 42 =0.42; and the theatrical probability is 50 = 0.5.
100 100
E.g. 4 Ask learners (in each small group) use the results of the experiments above (recorded in the tables above) to work out the experimental probability and compare to the theoretical probability of the following events (i.e. second table) i. rolling a 2 ii. rolling a number greater than 4 iii. rolling a 1 or a 3
E.g. 5 Put the results from all the small groups together ask the class to work out the experimental probabilities and compare to the theoretical probabilities of the events i. rolling a 2 ii. rolling a number greater than 4 iii. rolling a 1 or a 3
E.g. 6 Ask the learners their observations on whether or not the experimental probability is getting closer to the theoretical probability