B5 Mathematics · Term 2, Week 6
Number
Lesson notes
Learning Objectives
Indicator: B5.1.5.1.3 - Identify and describe percent from real-life contexts and solve problems using percent.
By the end of the lesson, learners can:
- Identify at least three real-life contexts where percentages are used, such as shop discounts, examination scores, and phone battery levels.
- Describe what a percentage represents in each context using the language “out of 100.”
- Interpret a circle graph showing data in halves, fourths, and eighths, and answer questions about the quantities represented.
- Solve word problems involving percentages in real-life situations, such as calculating discounts and interpreting survey results.
- Justify their answers when solving percentage problems by explaining the reasoning behind their calculations.
Sign in with your phone number to read the full note and download the GES plan - free.
Sign in with phone numberCurriculum details
- Strand
- Number (Strand 1)
- Content standard
- B5.1.5.1 - Demonstrate understanding of percentage of a given number
- Indicator
- B5.1.5.1.3 - Identify and describe percent from real-life contexts and solve problems using percent.
- Suggested placement
-
Term 2, Week 6
(Week 18 of the year)
Our suggestion, laid out in curriculum order across three terms of twelve weeks. NaCCA does not fix the week, so follow your school's scheme of learning.
- Curriculum reference
-
Mathematics Curriculum for Primary Schools (Basic 4-6), 2019, p. 83
Transcribed from the official NaCCA publication. Check this page against the source.
Exemplars (from the NaCCA curriculum)
E.g. 1 Discuss the contexts below in which fractions are used in real life and provide materials for pupils to act them out
- In shops - discounts, reduction to clear - 50%, etc.
- In exams expressing marks as percentages
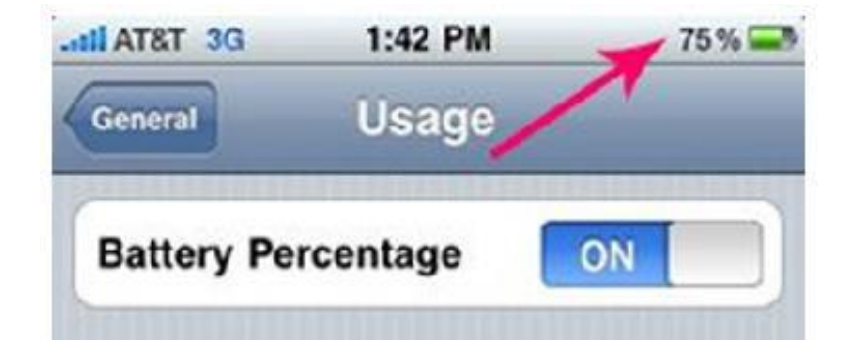
- Phone battery power used etc.
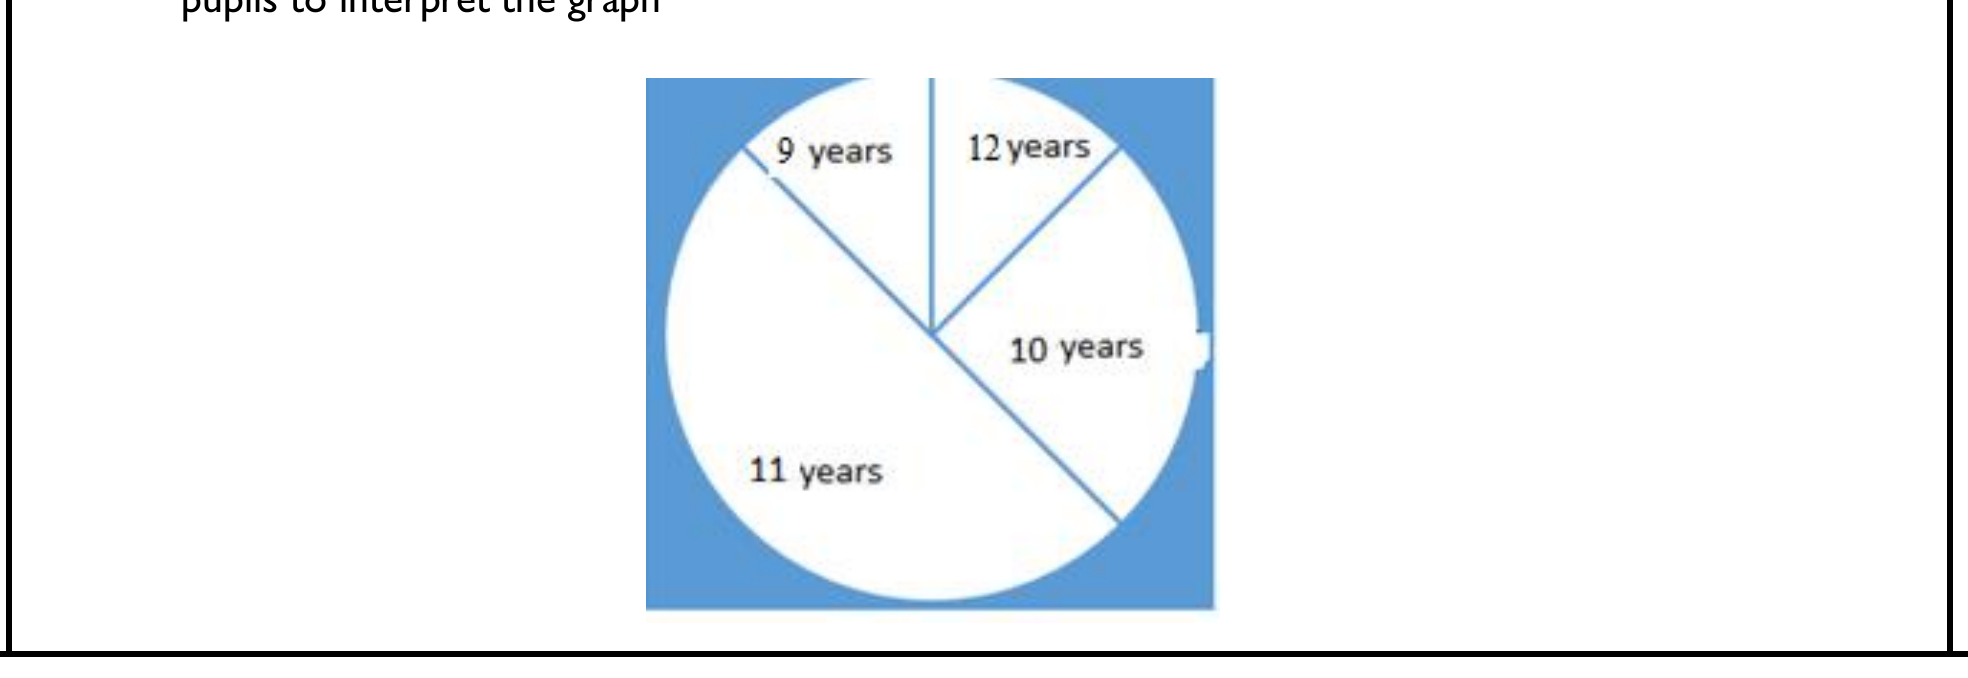
E.g. 2 Drawing circle graphs that represent that represent various percentages of halves, fourths and eighths. The graph shows the ages of pupils in Primary 4. If there are 40 pupils in the class, ask questions for pupils to interpret the graph