SHS1 Mathematics · Semester 1, Week 15
Patterns and Relations
Lesson notes
Learning Objectives
Indicator: 1.2.2.LI.1 - Distinguish between relations and functions using models such as graphs, investigate relationships between two number sets and determine rules for mappings or functions.
By the end of the lesson, learners can:
- Distinguish between a relation and a function, and identify one-to-one and many-to-one functions from arrow diagrams and sets of ordered pairs.
- Represent a given relation between two sets using an arrow diagram (mapping diagram).
- Determine whether a mapping is linear or exponential by examining constant differences or constant ratios in the given sets.
- Determine the rule for a linear mapping using the form y = ax + b, where a is the constant difference of the co-domain divided by the constant difference of the domain, and b is found by substituting a known coordinate.
- Determine the rule for a simple exponential mapping using the form y = ax² + bx + c where necessary, or by identifying the constant ratio pattern.
Sign in with your phone number to read the full note and download the GES plan - free.
Sign in with phone numberCurriculum details
- Strand
- Algebraic Reasoning (Strand 2)
- Sub-strand
- Patterns and Relations (2.2)
- Content standard
- 1.2.2.CS.1 - Demonstrate an understanding of mapping, relations, and functions and the ability to interpret graphs of a function and its applications in real life. 1.2.2.LO.1 Distinguish between relations and functions, determine the rules, then draw graphs of functions and interpret them.
- Indicator
- 1.2.2.LI.1 - Distinguish between relations and functions using models such as graphs, investigate relationships between two number sets and determine rules for mappings or functions.
- Suggested placement
-
Semester 1, Week 15
(Week 15 of the year)
Our suggestion, laid out in curriculum order across three terms of twelve weeks. NaCCA does not fix the week, so follow your school's scheme of learning.
- Source document note
-
The official curriculum document has a fault in this entry, so the curriculum text above is transcribed exactly as printed:
- exemplars - p.75: this exemplar sets a two-dimensional construct - a stacked fraction, an index or a column vector - which the text layer flattens into separate lines, so the parts are present but their vertical arrangement is lost; read the page
- exemplars - p.72: a tall brace here is drawn as three stacked pieces in a font with no /ToUnicode map; the opening and closing pieces are transcribed as { and } and the middle pieces dropped, so the brace may not sit exactly where the page prints it
- Curriculum reference
- NaCCA curriculum document, p. 72
Exemplars (from the NaCCA curriculum)
Using Talk for Learning strategy in mixed-ability groups, learners discuss the meaning of relations and functions with examples and types of relations.
Example: A Relation is a relationship between one group or set (input) and another group or set (output).

Types of Relations


Using Talk for Learning in the whole class, learners identify functions out of the relation and establish the meaning of a function as a relation which derives one OUTPUT for each given INPUT and give the types of function as one-to-one and one-to-many function.
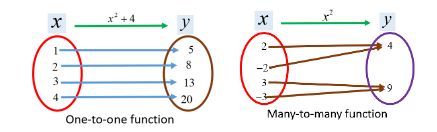
In collaborative groups, learners brainstorm and establish that mapping is the same as function, which maps elements in one set to a unique element in another set. Represent these relations on mapping diagrams.
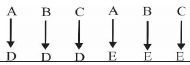
Example: Ama has three jumpers and two skirts. Combine these in six possible ways using an arrow diagram.
Solution: Let the jumpers be A, B, and C Let the skirts be D and E.
Make an arrow diagram showing the given relation between A and B. { The Gambia, Ghana, Liberia, } { Accra, Banjul, Freetown, } A = B = Nigeria, Sirerra Leone Lagos, Monrovia
Relation: Country → Capital of that Country.
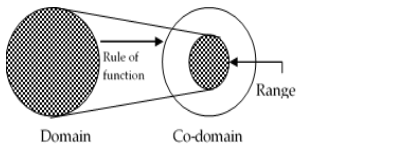
A subset of the co-domain that is actually used by the function is called the range of the function. This is illustrated in the figure below.
A subset of the co-domain, the range of the function is shown below:
Talk for Learning: In mixed-gender groups, learners should extend their idea of mapping to discuss linear mapping and establish the rule for linear mapping. Employ differentiated assessment and ensure values such as tolerance, truth, honesty, respect for others' views, etc., among learners.
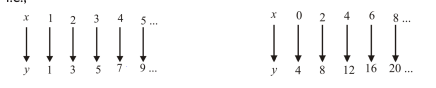
Example: Linear Mapping A mapping is said to be linear if the difference between the consecutive elements in both the domain and the co-domain is constant.
i.e.,
Example: Rule for Linear Mapping The rule is of the form 𝑦 = 𝑚𝑥 + 𝑐 Where 𝑦 = 𝑎𝑥 + 𝑏 constant difference of the co − domain 𝑚/𝑎 = constant difference in the domain And 𝑏 is the constant.
E.g. What is the rule of the mapping shown below?
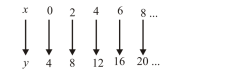
Solution The rule of the mapping is of the form 𝑦 = 𝑎𝑥 + 𝑏 8−4 𝑎 = 2−0 𝑎 = 2
Put the value of 𝑎 into the equation 𝑦 = 2𝑥 + 𝑏 ... (1) Now take any coordinates, say (0,4), and put them into Equation (1): 𝑥 = 4 And 𝑦 = 4, 4 = 2(0) + 𝑏 𝑏 = 4
Put b back into Equation (1) to give the rule for the mapping above. ∴ 𝑦 = 2𝑥 + 4
Talk for Learning: In convenient groups, learners should discuss exponential mapping and establish the rule of exponential mapping.
Example: Exponential Mapping A mapping is said to be Exponential if the ratio between the consecutive elements in the co-domain is constant. i.e.

Put the values of a, b and c into the form 𝑦 = 𝑎𝑥 2 + 𝑏𝑥 + 𝑐 ∴ 𝑦 = 2𝑥 2 + 3𝑥 + 1
Teaching and Learning Resources:
- * GeoGebra * Algebraic tiles * Graph boards
- * Patterns * Calculator
- * Technology tools such as * * Computer
- Mobile phone
- YouTube videos, etc.
Assessment (1.2.2.AS.1). The document marks these depth-of-knowledge levels for this indicator: Level 3 Strategic reasoning.