JHS3 Mathematics · Term 3, Week 8
Data
Full lesson notes coming
Notes for this lesson are being prepared. The curriculum details below are complete and ready to use for your planning.
Curriculum details
- Strand
- Handling Data (Strand 4)
- Sub-strand
- Data (4.1)
- Content standard
- B9.4.1.1 - Select, justify, and use appropriate methods of collecting data (grouped/ungrouped), use the data to construct and interpret frequency tables and histogram and use it to determine the mode and to solve and/or pose problems.
- Indicator
- B9.4.1.1.2 - Organise data (grouped/ungrouped) present it in frequency tables, line graphs, pie graphs, bar graphs and/or pictographs (representations include infographics, waffle diagrams, box and whisker plots and stem and leaf plots) and analyse it to solve and/or pose problems.
- Suggested placement
-
Term 3, Week 8
(Week 32 of the year)
Our suggestion, laid out in curriculum order across three terms of twelve weeks. NaCCA does not fix the week, so follow your school's scheme of learning.
- Curriculum reference
-
Mathematics, Common Core Programme (JHS1-JHS3), 2023, p. 211
Transcribed from the official NaCCA publication. Check this page against the source.
Exemplars (from the NaCCA curriculum)
E.g. 1 -Thirty bulbs were life-tested and their lifespan to the nearest hour are as follows:

i. Present the raw data in a frequency table by completing the table below:
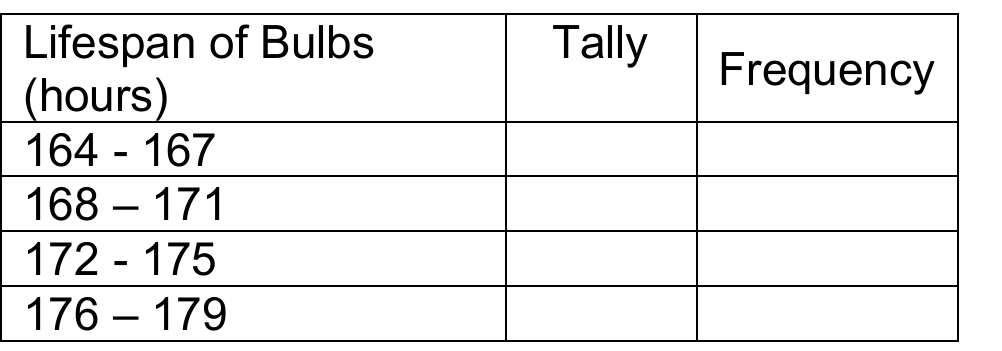
Lifespan of Bulbs Tally Frequency
(hours)
164 - 167
168 - 171
172 - 175
176 - 179
ii. What is the modal group? Justify your decision for that choice.
iii. Complete the stem and leaf plots below to
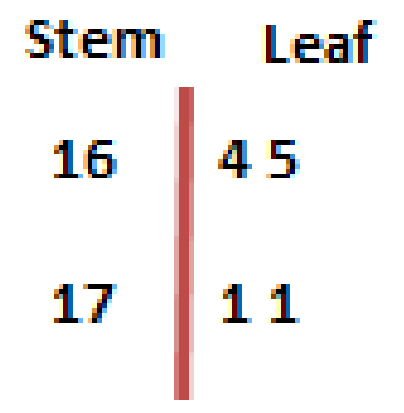
display the raw data.
Use the plot to solve the following problems.
a. Find the range of the lifespan of bulbs
b. What is the mode lifespan?
c. What is the median lifespan?
d. What other problems can you pose?
E.g. 2 The pictograph below describes the number of boys and girls in each class in Kojokrom Junior High School
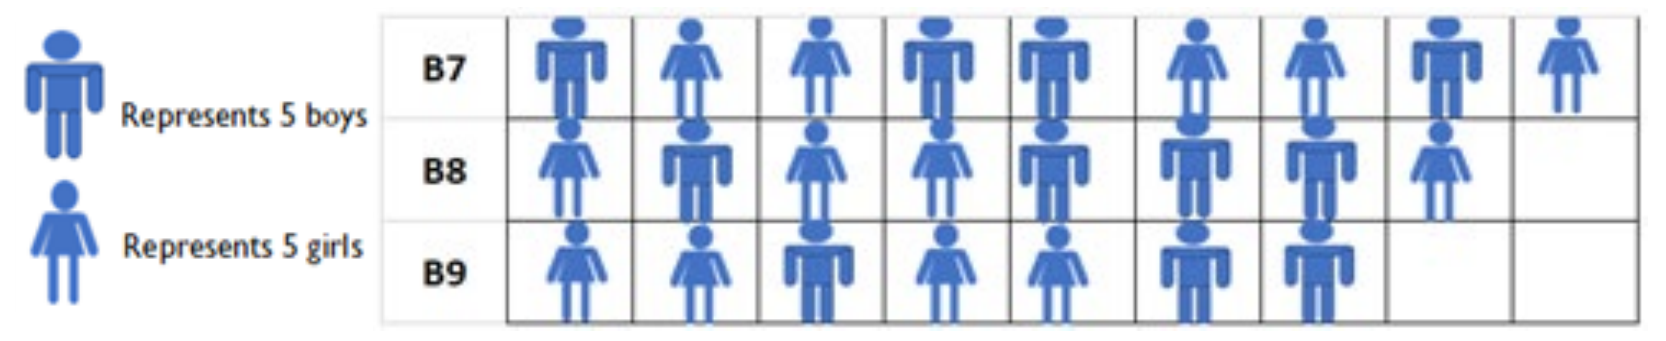
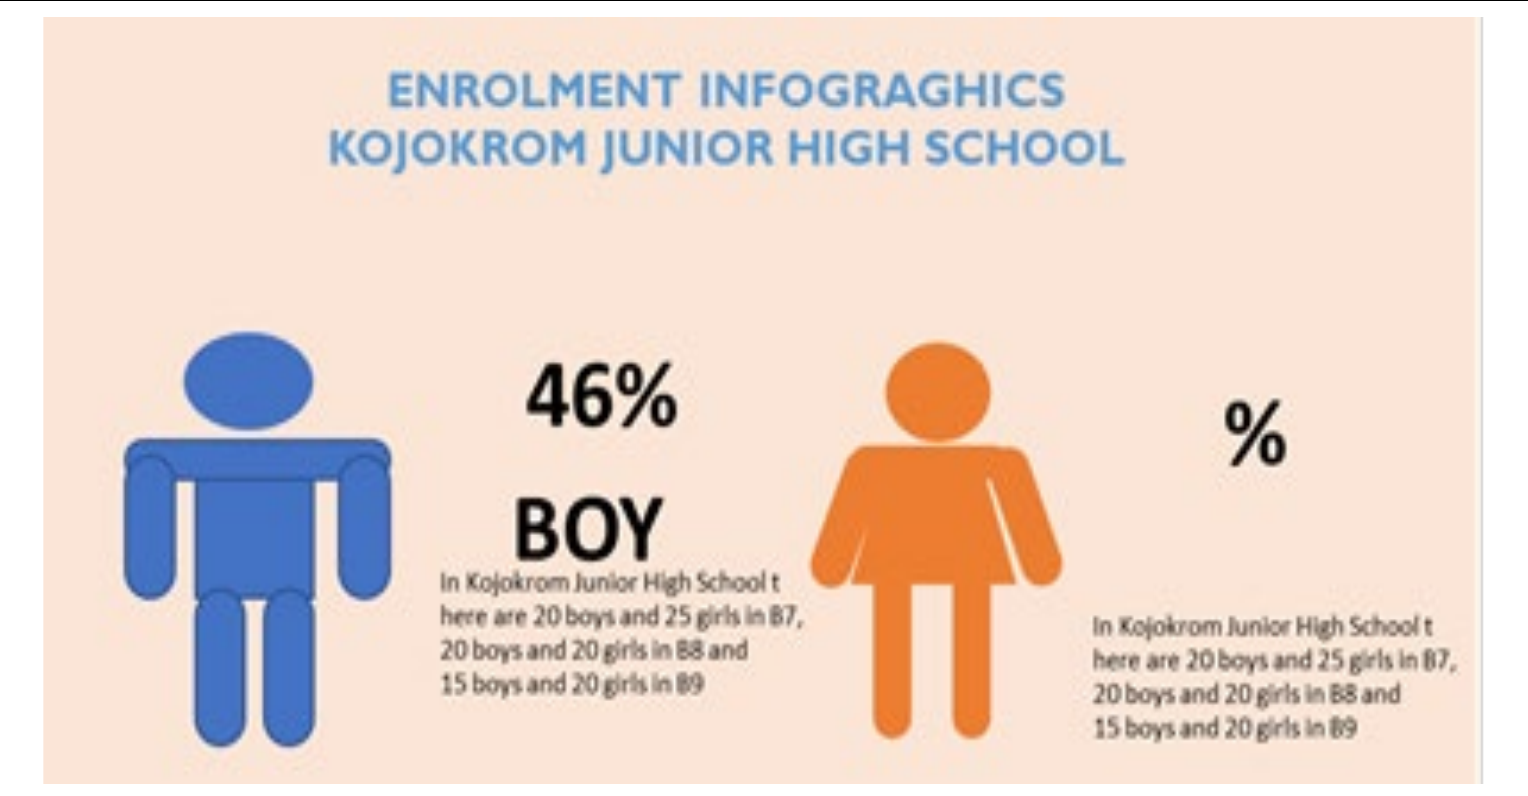
i. What is the percentage of boys and of girls in the school?
ii. Use your answers in (i) to represent the data by copying and completing the following infographic