JHS1 Mathematics · Term 3, Week 10
Data
Lesson notes
Learning Objectives
Indicator: B7.4.1.2.1 - Calculate the mean for a given ungrouped data and use it to solve problems
By the end of the lesson, learners can:
- Define the mean as the sum of all data items divided by the number of items.
- Calculate the mean of a given ungrouped data set arranged in a list.
- Calculate the mean of data presented in a frequency table.
- Use the mean to solve real-life problems, including finding a missing score when the target average is known.
- Interpret the mean as a representative or typical value of a data set.
Sign in with your phone number to read the full note and download the GES plan - free.
Sign in with phone numberCurriculum details
- Strand
- Handling Data (Strand 4)
- Sub-strand
- Data (4.1)
- Content standard
- B7.4.1.2 - Determine the measures of central tendency (mean, median, mode) for a given ungrouped data and use it to solve problems
- Indicator
- B7.4.1.2.1 - Calculate the mean for a given ungrouped data and use it to solve problems
- Suggested placement
-
Term 3, Week 10
(Week 34 of the year)
Our suggestion, laid out in curriculum order across three terms of twelve weeks. NaCCA does not fix the week, so follow your school's scheme of learning.
- Curriculum reference
-
Mathematics, Common Core Programme (JHS1-JHS3), 2023, p. 83
Transcribed from the official NaCCA publication. Check this page against the source.
Exemplars (from the NaCCA curriculum)
E.g. 1 Find the mean for a data set by dividing the sum of all the items in the data set by the by the number of items.
i. The mean for the data set {8, 9, 7, 6, 8,10} is 8+9+7+6+8+10 = 8 6
ii. Find the mean for the data set below which is the marks obtained out of a total of 5 in a mathematics class test.
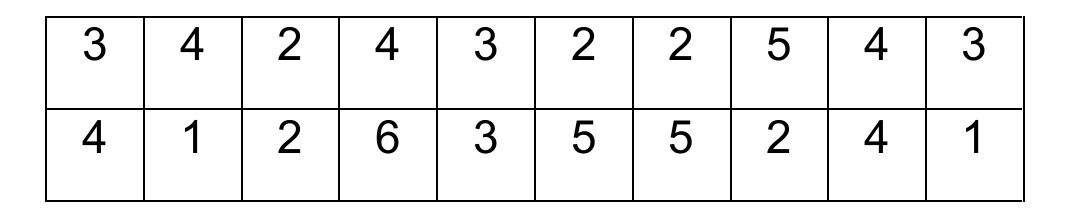
3 4 2 4 3 2 2 5 4 3
4 1 2 6 3 5 5 2 4 1
E.g. Find the mean for a data set (in a frequency table) by dividing the sum of all the items in the data set by the by the number of items.
i. Find the mean for the marks obtained out of a total of 5 in a mathematics class test presented in the frequency table:

Score 1 2 3 4 5 Frequency 2 6 4 5 3
ii. Find the mean of the ages of children at a party presented in the frequency table:

Ages (x): 1 3 5 6 7 8 9 10 Frequency (f): 2 5 6 10 8 5 3 1
E.g. 3 Solve problems involving calculating the mean or average.
i. A shop keeper sold the following loaves of bread over the last 6 days: 25, 48, 25, 33, 57, 50. What was the average number of loaves sold each day?
ii. Sena has had the following scores in five of the common core subjects this term: 75, 87, 90, 88, 79. If she wishes to have an average score of 85, what must she score on the sixth test? i.e. Set up the problem like this: (75 + 87 + 90 + 88 + 79 + [] ) ÷ 6 = 85