B4 Mathematics · Term 3, Week 11
Data Collection, Organization, Presentation, Interpretation and Analysis
Full lesson notes coming
Notes for this lesson are being prepared. The curriculum details below are complete and ready to use for your planning.
Curriculum details
- Strand
- Data (Strand 4)
- Sub-strand
- Data Collection, Organization, Presentation, Interpretation and Analysis (4.1)
- Content standard
- B4.4.1.2 - Construct and interpret pictographs and bar graphs involving many-to-one correspondence to draw conclusions.
- Indicator
- B4.4.1.2.1 - Identify common features of graphs that use many-to-one correspondence and use that understanding to draw bar graphs or pictographs, complete with title, labelled axes, key or legend, to represent data collected (up to 4 categories of data).
- Suggested placement
-
Term 3, Week 11
(Week 35 of the year)
Our suggestion, laid out in curriculum order across three terms of twelve weeks. NaCCA does not fix the week, so follow your school's scheme of learning.
- Source document note
-
The official curriculum document has a fault in this entry, so the curriculum text above is transcribed exactly as printed:
- exemplars - p.52
- Curriculum reference
-
Mathematics Curriculum for Primary Schools (Basic 4-6), 2019, p. 52
Transcribed from the official NaCCA publication. Check this page against the source.
Exemplars (from the NaCCA curriculum)
E.g. 1. Refer to example in B4.4.1.1.4 to common features of graphs that use many-to-one correspondence. Examine such features as title, vertical axis and label, hofrizontal axis and label, key or legend.
E.g. 2. Give students data presented in a table to draw bar graph complete with title, labelled axes, key. The table show amount of rainfall recorded in Kumasi in the half of the year.
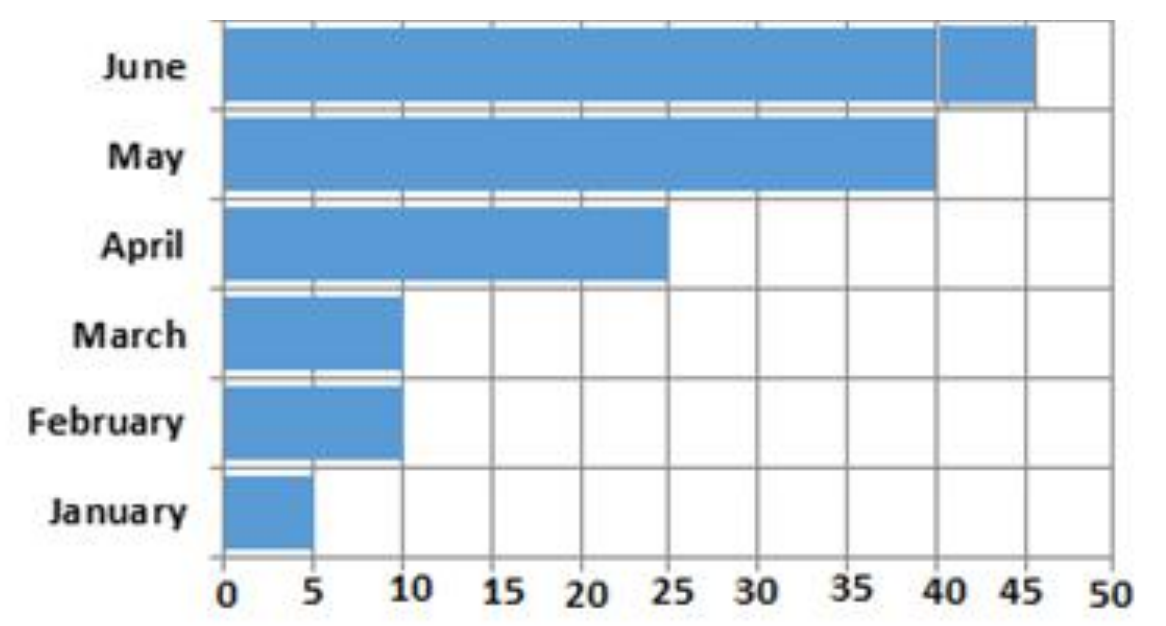
E.g. 3. Give pupils data on energy usage by households in a community over a period (e.g. six months) presented in tables for them to draw bar graph complete with title, labelled axes, key. Ask questions for pupils to read and interpret graphs. The rainfall table (January 5mm, February 10mm, March 10mm, April 25mm, May 40mm, June 45mm) and the bar graph drawn from it are set below E.g. 2; the table's cells interleave with the exemplar in the text layer and the figure shows both.