B4 Mathematics · Term 3, Week 10
Data Collection, Organization, Presentation, Interpretation and Analysis
Full lesson notes coming
Notes for this lesson are being prepared. The curriculum details below are complete and ready to use for your planning.
Curriculum details
- Strand
- Data (Strand 4)
- Sub-strand
- Data Collection, Organization, Presentation, Interpretation and Analysis (4.1)
- Content standard
- B4.4.1.1 - Demonstrate an understanding of many-to-one correspondence in displaying, and reading or interpreting, graphs
- Indicator
- B4.4.1.1.2 - Use an understanding of many-to-one correspondence to display or construct graphs
- Suggested placement
-
Term 3, Week 10
(Week 34 of the year)
Our suggestion, laid out in curriculum order across three terms of twelve weeks. NaCCA does not fix the week, so follow your school's scheme of learning.
- Source document note
-
The official curriculum document has a fault in this entry, so the curriculum text above is transcribed exactly as printed:
- exemplars - p.48
- Curriculum reference
-
Mathematics Curriculum for Primary Schools (Basic 4-6), 2019, p. 48
Transcribed from the official NaCCA publication. Check this page against the source.
Exemplars (from the NaCCA curriculum)
E.g. 1. Display a table for of illnesses P4 pupils have had in school last academic year. Discuss with pupils how many objects/cut-outs will be required to display or construct a graph of the illnesses in the table if [] represents 2 pupils
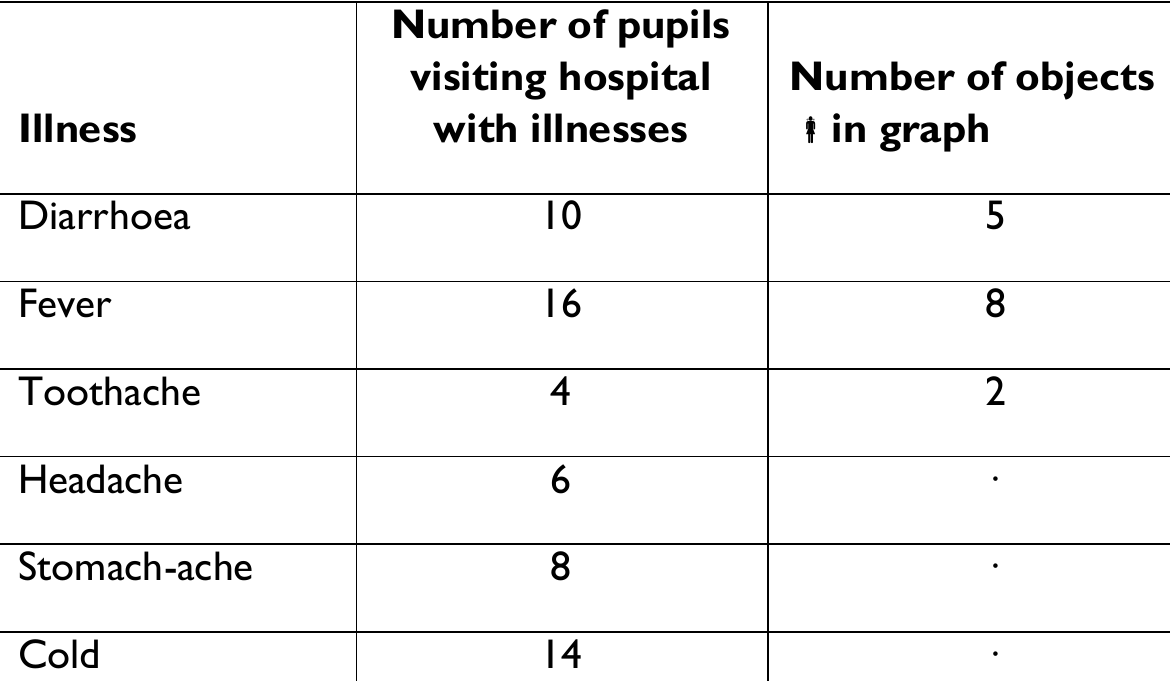
E.g. 2. Put a chart with labelled axes on the board; places several card cut-outs of the object "[]" on the table. Ask pupils to go in turns to construct the graph of the illnesses in the chart by pasting the right number of cut-outs in the columns above each illness as in the figure below
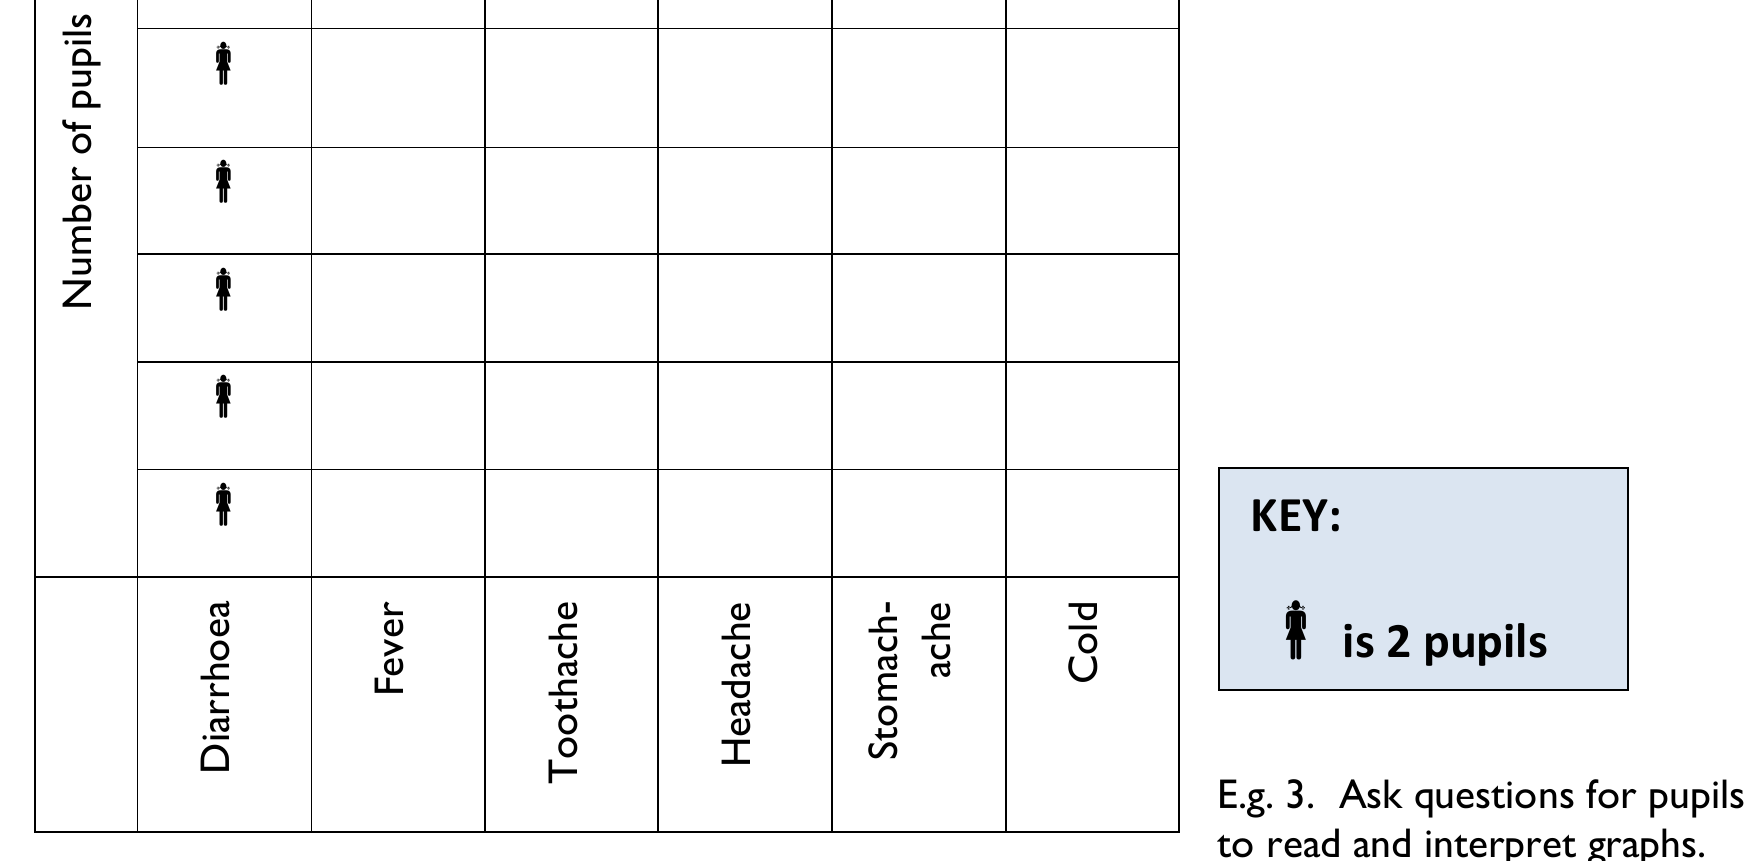
E.g. 3. Ask questions for pupils to read and interpret graphs. Ask pupils also to write questions based on the graph for their friends to answer
E.g. 4. Give learners tables with data that require the use an understanding of many-to-one correspondence to construct their graphs The pictograph key is a small drawing of a person, written here as []. The illnesses table (Diarrhoea 10/5, Fever 16/8, Toothache 4/2, Headache 6, Stomach-ache 8, Cold 14) is set below E.g. 1 and its cells interleave with the exemplar in the text layer; figure p48-1.png shows it, and p49-1.png shows the pictograph grid and KEY on printed p.49.