SHS3 Mathematics · Semester 2, Week 14
Statistical Reasoning and Its Application in Real Life
Full lesson notes coming
Notes for this lesson are being prepared. The curriculum details below are complete and ready to use for your planning.
Curriculum details
- Strand
- Making Sense of and Using Data (Strand 4)
- Sub-strand
- Statistical Reasoning and Its Application in Real Life (4.1)
- Content standard
- 3.4.1.CS.2 - Demonstrate the ability to compare different data sets and use appropriate vocabulary to contribute to mathematical and everyday discussions and make inferences about the information gathered. 3.4.1.LO.2 Compare different datasets and use mathematical vocabulary and language (concretely, pictorially, symbolically, spoken or written, etc.) to contribute to mathematical and everyday discussions using valid and reliable data to explain and justify the information produced from the data.
- Indicator
- 3.4.1.LI.1 - Compare the quality of different datasets using knowledge and skills acquired from data analysis techniques you learned in earlier statistics work.
- Suggested placement
-
Semester 2, Week 14
(Week 34 of the year)
Our suggestion, laid out in curriculum order across three terms of twelve weeks. NaCCA does not fix the week, so follow your school's scheme of learning.
- Source document note
-
The official curriculum document has a fault in this entry, so the curriculum text above is transcribed exactly as printed:
- exemplars - p.373: this exemplar sets a two-dimensional construct - a stacked fraction, an index or a column vector - which the text layer flattens into separate lines, so the parts are present but their vertical arrangement is lost; read the page
- Curriculum reference
- NaCCA curriculum document, p. 373
Exemplars (from the NaCCA curriculum)
Experiential Learning: In convenient groups, tasks learners to compare the quality of given data sets and draw conclusions on the appropriateness of the data in relation to the purpose of the data and its analysis techniques.
Example: Data was taken on the heights of twelve SHS 3 learners in Joaboso Senior High School. The tables below show how two researchers recorded the same data (heights of the students in centimetres and in metres rounded to the nearest tenth).
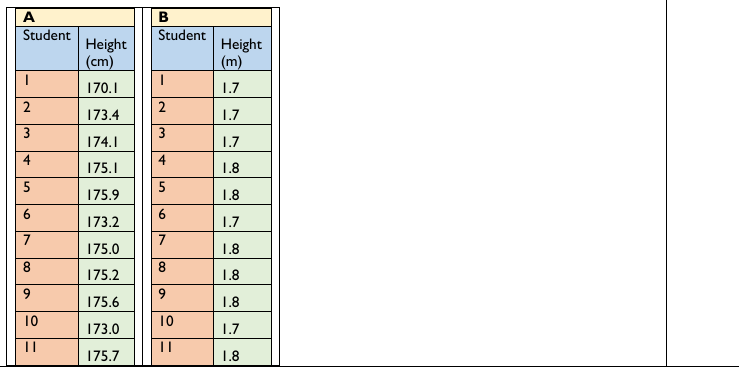
A B Student Student Height Height (cm) (m) 1 1 170.1 1.7 2 2 173.4 1.7 3 3 174.1 1.7 4 4 175.1 1.8 5 5 175.9 1.8 6 6 173.2 1.7 7 7 175.0 1.8 8 8 175.2 1.8 9 9 175.6 1.8 10 10 173.0 1.7 11 11 175.7 1.8
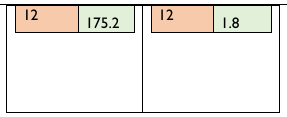
 12 12 175.2 1.8
i. Which of the two data sets gives a better representation of the heights of the students? ii. Which of the data sets will aid easy analysis and interpretations, and why? Using think-pair-share activities, task learners to make inferences from a given data and give reasons for their choices. Offer other learners the opportunity to make their own inferences as long as they are referring to the data.
Example: The chart below shows the number of hungry people in the world by year from 2000 to 2018.
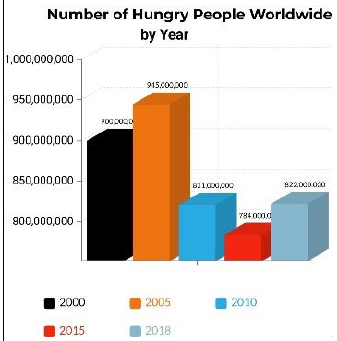
From the chart, what is your opinion on the trend of hunger across the world? i. ii. What will be your recommendations to world leaders on the strategies they can adopt to combat the menace?
Using Talk for Learning strategy, engage learners in a class debate where they support their argument with data and the use of appropriate mathematics terminology.
Example: As a speaker in a school debate on the topic: "The rise of HIV/AIDs cases in Ghana, a course for worry or a mere public scare", obtain data on HIV/AIDs cases from the Ghana AIDs Commission or from any reputable source (radio, TV, Newspaper, etc.), analyse the data (including using any appropriate technological tool) using charts/tables to support your arguments for or against the motion.
Project-based Learning: Assign project works to learners (individually or in groups) to obtain current data about contemporary issues of interest, then make conclusions, give criticisms and make useful recommendations. As they embark on the project, encourage them to be tolerant, friendly, openminded, patient, hardworking, etc., as they interact with their peers in their assigned project.
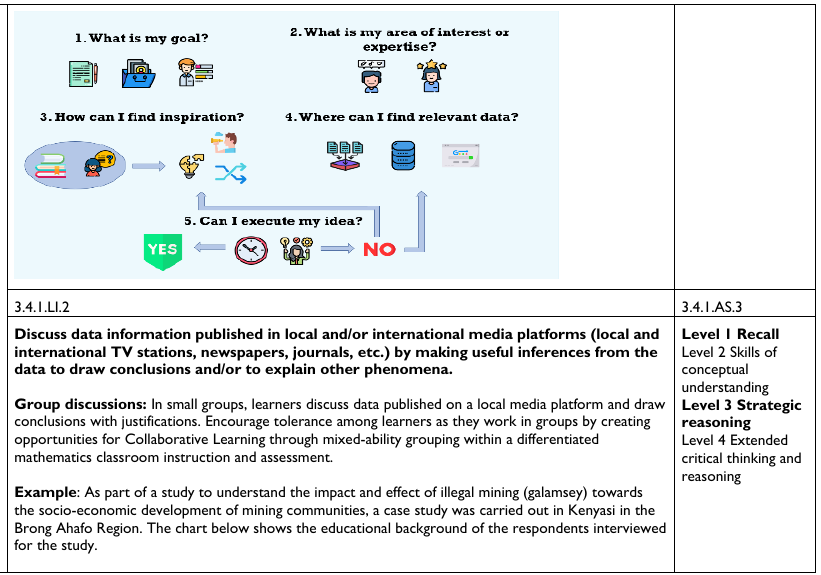
Example: Using a mind map such as the one below, learners must think critically, design a mini-project, and execute it to its successful conclusion.
Teaching and Learning Resources:
- * Samples of bivariate data. * Computer application software such as MS Excel, MS Word, Wordpad, etc. * Mathematical sets. * Technology tools such as computers, mobile phones, etc. * Graph sheets * A computer with data-managment software like MS Excel, MS PowerPoint, etc., * A4 and A3 papers, manila cards, flip charts, markers, colour pens, etc.
Assessment (3.4.1.AS.1). The document marks these depth-of-knowledge levels for this indicator: Level 3 Strategic reasoning; Level 4 Extended critical thinking and reasoning.