SHS1 Additional Mathematics · Semester 1, Week 12
Applications of Algebra
Lesson notes
Learning Objectives
Indicator: 1.1.2.LI.9 - Recognise linear equations in two variables and draw their graphs manually using appropriate technology. Find the area enclosed by the two graphs.
By the end of the lesson, learners can:
- Identify whether a given equation in two variables is linear or non-linear and justify their reasoning using the form y = mx + c.
- Draw the graph of a linear equation in two variables manually using a table of values and graph paper.
- Use a graphing tool or app to verify graphs of linear equations drawn by hand.
- Determine the point of intersection of two linear graphs by reading it from the diagram.
- Calculate the area enclosed by two intersecting linear graphs and the axes or between the two graphs over a given interval.
Sign in with your phone number to read the full note and download the GES plan - free.
Sign in with phone numberCurriculum details
- Strand
- Modelling with Algebra (Strand 1)
- Sub-strand
- Applications of Algebra (1.2)
- Content standard
- 1.1.2.CS.1 - Demonstrate knowledge and understanding of applying algebraic processes and reasoning involving sequence, functions, and linear programming. 1.1.2.LO.1 Examine, analyse, determine and predict other terms in a pattern/sequence. 1.1.2.LO.2 Distinguish among various types of relations, find the domain and range of, and evaluate functions. 1.1.2.LO.3 Show that a function is injective (into) and/or surjective (onto). Find the inverse, describe the relationship between two variables and establish composite functions. 1.1.2.LO.4 Graph linear and quadratic functions and determine the intercepts. 1.1.2.LO.5 Find graphical and algebraic solutions to a system of three linear equations in three variables and apply them to solve real life problems. 1.1.2.LO.6 Perform algebraic manipulations on polynomial functions and graph polynomial functions. 1.1.2.LO.7 Find the domain, range, and zero of a rational function and state when it is undefined. 1.1.2.LO.8 Identify and describe the order of a matrix, the identity matrix and the zero matrix; find the determinant and perform basic arithmetic operations on 2 by 2 matrices (addition and subtraction).
- Indicator
- 1.1.2.LI.9 - Recognise linear equations in two variables and draw their graphs manually using appropriate technology. Find the area enclosed by the two graphs.
- Suggested placement
-
Semester 1, Week 12
(Week 12 of the year)
Our suggestion, laid out in curriculum order across three terms of twelve weeks. NaCCA does not fix the week, so follow your school's scheme of learning.
- Source document note
-
The official curriculum document has a fault in this entry, so the curriculum text above is transcribed exactly as printed:
- exemplars - p.109: adjacent duplicated CambriaMath characters were collapsed, but this PDF also maps some equation glyphs to the wrong letter or operator; verify every mathematical expression in this row against the rendered page
- Curriculum reference
- NaCCA curriculum document, p. 109
Exemplars (from the NaCCA curriculum)
Activity 2: Identifying linear equations and determining areas enclosed by graphs
Collaborative Learning, Experiential Learning, and Talk for Learning Approaches:
- Collaborative Learning: Learners work in pairs to identify linear and non-linear graphs. With the aid of technological tools by graph paper, learners draw graphs of linear functions and provide reasons why such graphs are linear or curvilinear.
- NB: A linear function is of the form 𝑓(𝑥) = 𝑎 + 𝑏. An example of a linear function is (𝑥) = 𝑎 + 𝑏.
- Any function not in (𝑥) = 𝑎 + 𝑏 is a nonlinear function, e.g. f(x) = x 2 is nonlinear and is called a quadratic function. Example: Which of the following are linear, and which are non-linear?
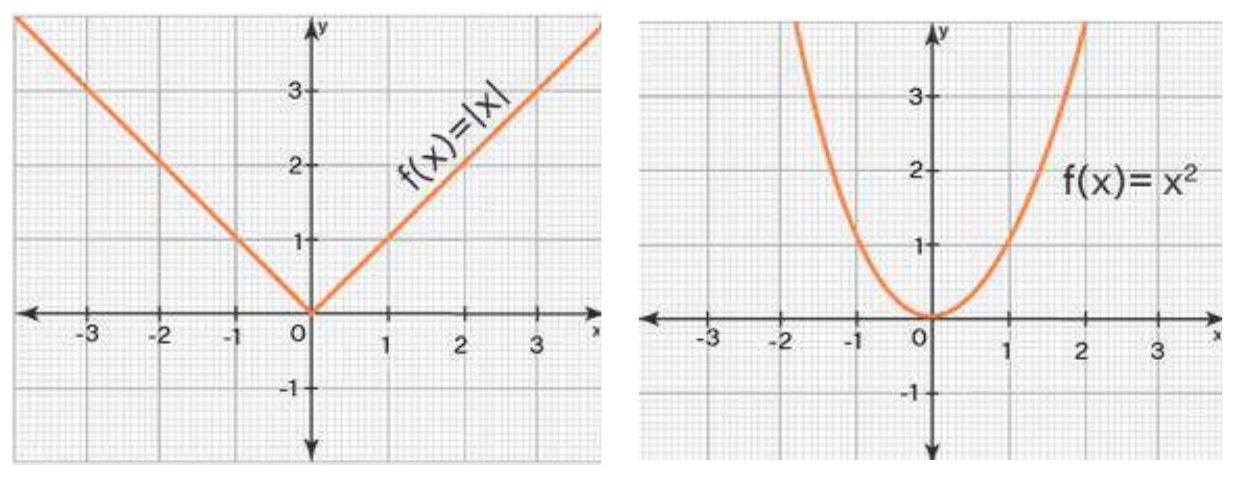
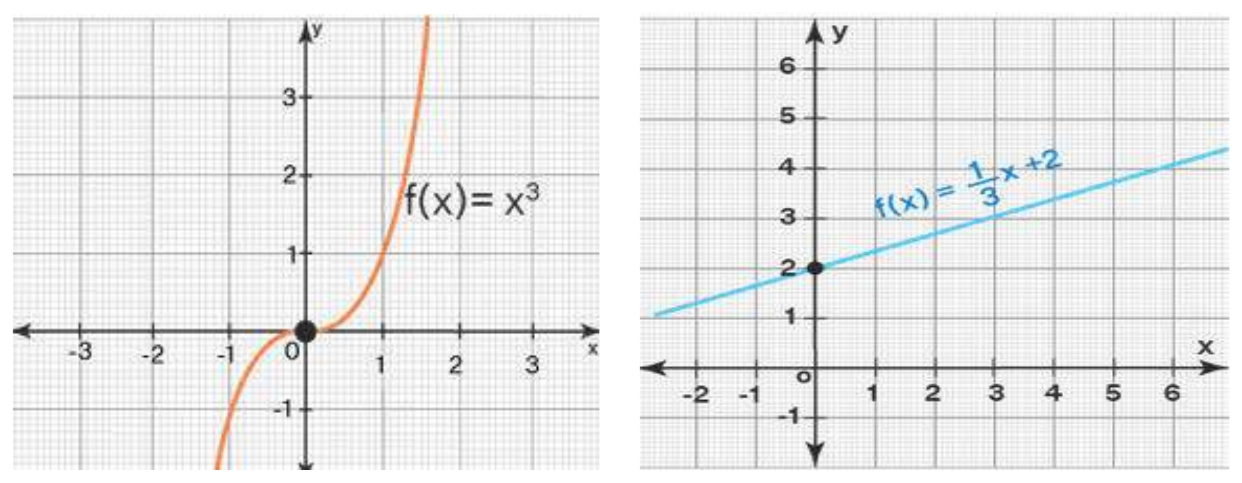
Teaching and Learning Resources:
- Cut out shapes of different colours and orientation
- Maths Technology learning apps, tools and devices
- Chalkboard illustrations
- Worksheets
- Cut-out geometrical shapes of different colours and orientation
Assessment (1.1.2.AS.9). The document marks these depth-of-knowledge levels for this indicator: Level 1 Recall; Level 3 Strategic reasoning.