SHS3 Additional Mathematics · Semester 2, Week 7
Application of Calculus
Full lesson notes coming
Notes for this lesson are being prepared. The curriculum details below are complete and ready to use for your planning.
Curriculum details
- Strand
- Calculus (Strand 3)
- Sub-strand
- Application of Calculus (3.2)
- Content standard
- 3.3.2.CS.1 - Demonstrate conceptual Find the area under a constant function, curves and distinguish between total, net and understanding of integration to find distances, areas under curve, volumes and other related real life problems. 3.3.2.LO.1 Determine distance, area under curve and solid of volumes formed under revolution.
- Indicator
- 3.3.2.LI.2 - Find the area between two curves.
- Suggested placement
-
Semester 2, Week 7
(Week 27 of the year)
Our suggestion, laid out in curriculum order across three terms of twelve weeks. NaCCA does not fix the week, so follow your school's scheme of learning.
- Source document note
-
The official curriculum document has a fault in this entry, so the curriculum text above is transcribed exactly as printed:
- exemplars - p.523: adjacent duplicated CambriaMath characters were collapsed, but this PDF also maps some equation glyphs to the wrong letter or operator; verify every mathematical expression in this row against the rendered page
- exemplars - p.526: a stacked fraction, matrix, vector or other two-dimensional construct is flattened by the text layer; all visible parts require comparison with the rendered page
- Curriculum reference
- NaCCA curriculum document, p. 523
Exemplars (from the NaCCA curriculum)
Talk for Learning, Think-pair-share, Experiential Learning, and Group Work/Collaborative Learning.
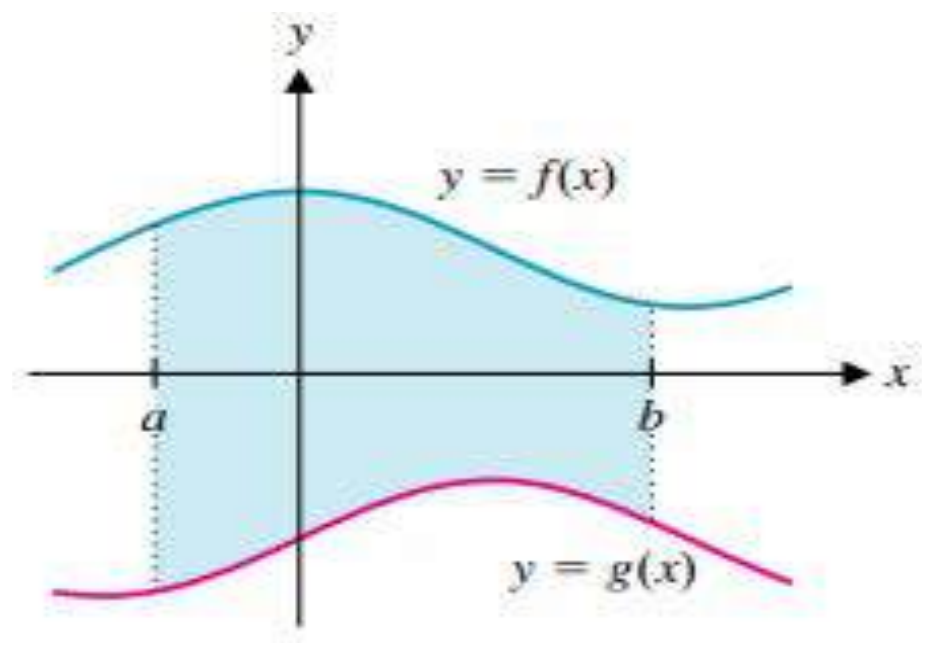
If 𝑦 = 𝑓(𝑥) lies above 𝑦 = 𝑔(𝑥) 𝑓 𝑥 = 𝑎 𝑡 𝑥 = 𝑏, the area of the region between 𝑓(𝑥)𝑎 𝑔(𝑥) from 𝑥 = 𝑎 𝑎 𝑥 = 𝑏 𝑖
% 𝐴 = t[𝑓(𝑐 L ) − 𝑔(𝑐 L )] ∆𝑥
L4! ' = î [𝑓(𝑥) − 𝑔(𝑥)] 𝑑 &
y NB: ∫ z [f(x) − g(x)] dx is valid only when f (x) ≥ g(x) on the interval [a, b]. In general, the area y between y = f (x) and y = g(x) for a ≤ x ≤ b is given by∫ z | f (x) − g(x)| dx. Notice that to
evaluate this integral, you must evaluate ∫ | [f (x) − g(x)] dx on all subintervals, where f (x) ≥ g(x), {
{ then evaluate ∫ | [f (x) − g(x)] dx on all subintervals where g(x) ≥ f (x) and finally, add the integrals together.
Example 1
- Find the area of the region between 𝑦 = 2𝑥 ) − 4𝑥 + 6 and 𝑦 = −𝑥 ) + 2𝑥 + 1 from 𝑥 = 1 to 𝑥 = 2
Solution:
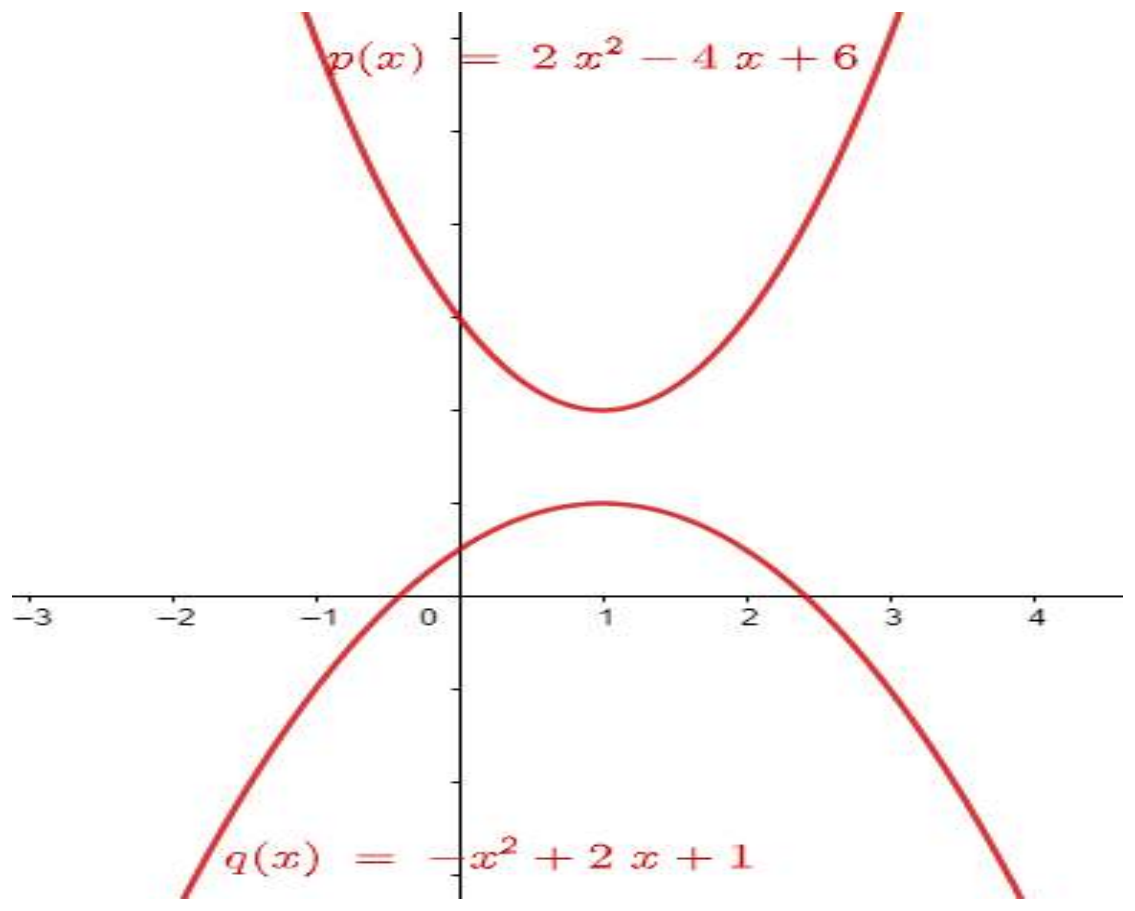
) ) ∫ ! [(2𝑥 ) − 4𝑥 + 5) − (−𝑥 ) + 2𝑥 + 1)] 𝑑 = ∫ ! (3𝑥 ) − 6𝑥 + 5) 𝑑 = [𝑥 " − 3𝑥 ) + 5𝑥] !) =3 The area enclosed by two graphs.
- Find the area bounded by the graphs of 𝑦 = 𝑥 ) and 𝑦 = 2 − 𝑥 ) for 0 ≤ 𝑥 ≤ 2.
Solution:
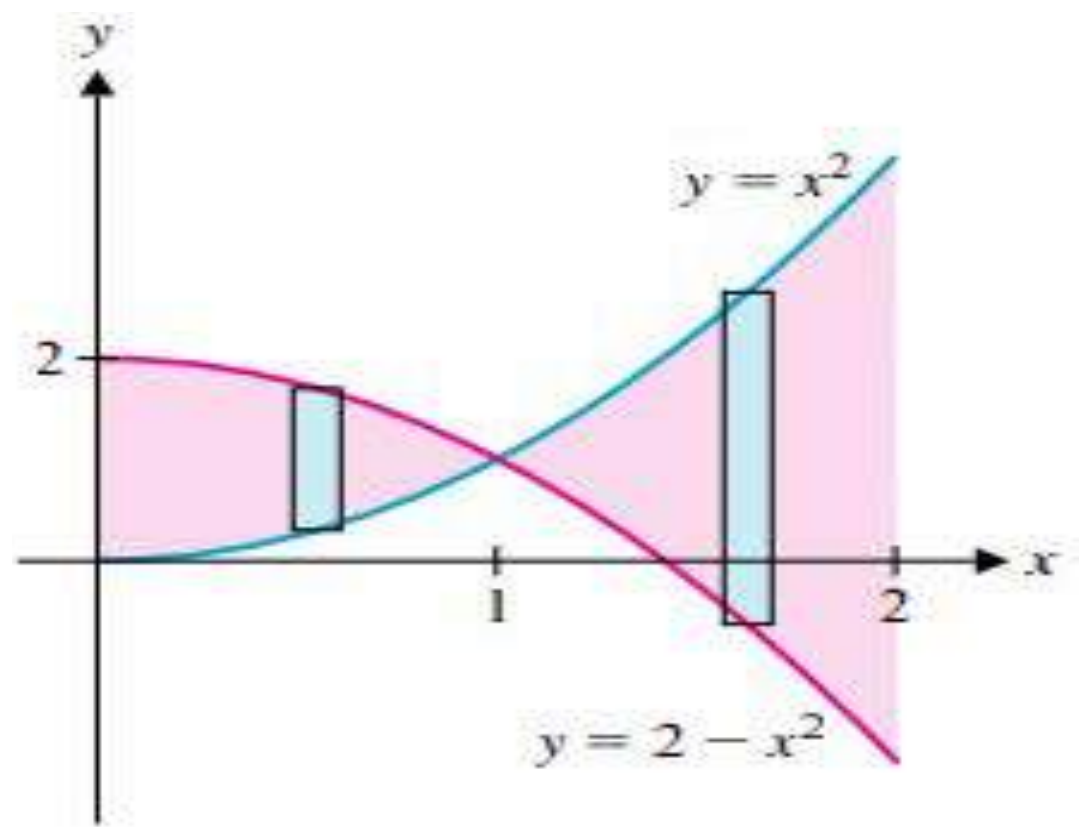
Graph of 𝑦 = 𝑥 ) and 𝑦 = 2 − 𝑥 ) Notice from Figure 2 that since the two curves intersect in the middle of the interval, we will need to compute two integrals, one on the interval where 2 − 𝑥 ) > 𝑥 ) and one on the interval where 𝑥 ) ≥ 2 − 𝑥 ) . To find the point of intersection, we solve 𝑥 ) = 2 − 𝑥 ) , so that 2𝑥 ) = 2 or 𝑥 ) = 1 or 𝑥 = ±1. Since 𝑥 = −1 is outside the interval of interest, the only intersection of note is at 𝑥 = 1. The area is ! ) 𝐴 = î [(2 − 𝑥 ) ) − 𝑥 ) ] 𝑑 + î [𝑥 ) − (2 − 𝑥 ) )] 𝑑 ( ! 2𝑥 " 1 2𝑥 " 2 = )2𝑥 −
- + ) − 2𝑥* 3 0 3 1 2 16 2 4 4 4 = £2 − ¤ − (0 − 0) + £ − 4¤ − £ − 2¤ = + + = 4 3 3 3 3 3 3
- Find the area bounded by the graphs of 𝑦 = 3 − 𝑥 and 𝑥 ) − 9.
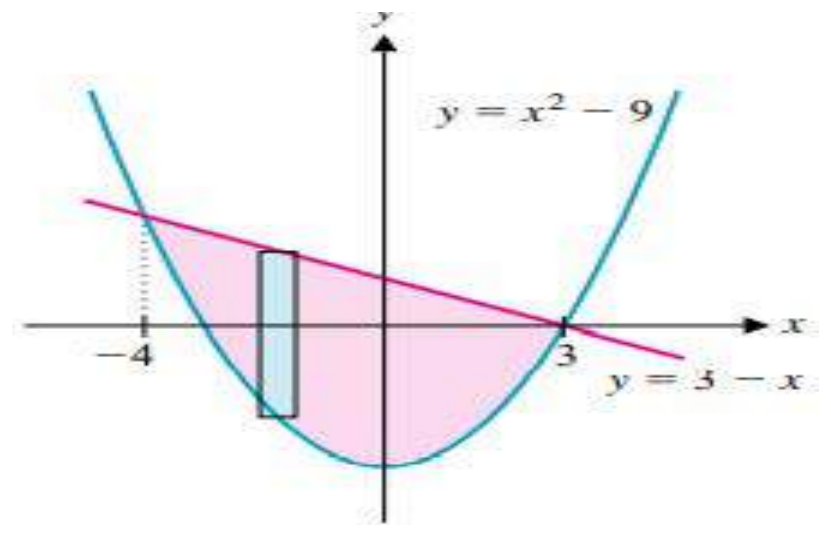
Graph of 𝑦 = 3 − 𝑥 and 𝑥 ) − 9
- Find the area bounded by the graphs of 𝑥 = 𝑦 ) and 𝑥 = 2 − 𝑦 ) .
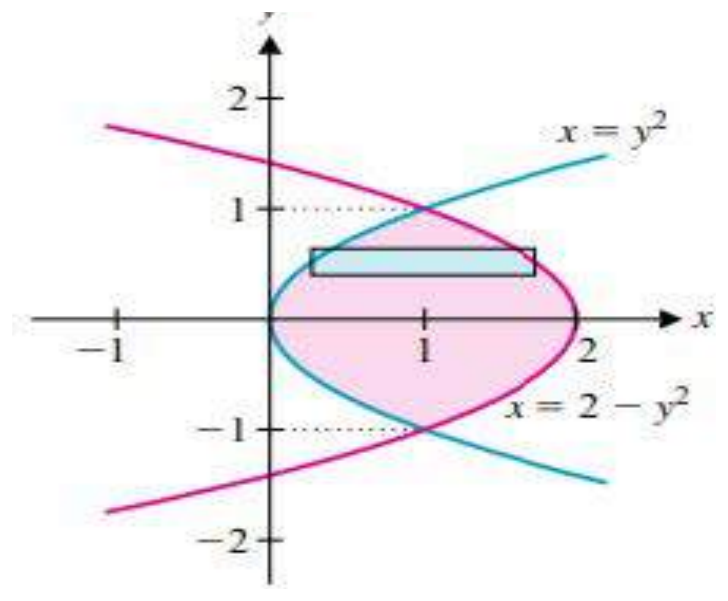
Graph of 𝑥 = 𝑦 ) and 𝑥 = 2 − 𝑦 )
Teaching and Learning Resources:
- Reading resource colour pens
- Notebook
- Graph sheets
- Mathematical sets,
- Technological tools.
- Curriculum
- Cardboard
Assessment (3.3.2.AS.2). The document marks no depth-of-knowledge level for this indicator.