SHS2 Additional Mathematics · Semester 1, Week 10
Application of Algebra
Lesson notes
Learning Objectives
Indicator: 2.1.1.LI.7 - Predict and identify the region representing the solution to systems of linear inequality.
By the end of the lesson, learners can:
- Solve a system of linear inequalities in one variable using algebraic manipulation and state the common range of values.
- Sketch the boundary lines of two or three linear inequalities on the same Cartesian plane and determine the correct half-planes by testing points.
- Identify and shade the feasible region that satisfies all inequalities in a system simultaneously.
- Predict the feasible region by reasoning about the direction of each inequality before drawing, then confirm graphically.
- Interpret the feasible region of a system of linear inequalities in a real-life context and justify why corner points matter.
Sign in with your phone number to read the full note and download the GES plan - free.
Sign in with phone numberCurriculum details
- Strand
- Modelling with Algebra (Strand 1)
- Sub-strand
- Application of Algebra (1.1)
- Content standard
- 2.1.1.CS.3 - Demonstrate understanding of the laws and properties of indices and apply the ideas to solve problems. 2.1.1.LO.1 Investigate De Morgan's law on sets algebraically and graphically, formulate and solve real life problems up to three sets. 2.1.1.LO.2 Model sequence recursively and explicitly, and establish the relationship between the two forms, as well as solve real life problems involving linear and exponential sequences and series. 2.1.1.LO.3 Apply indices and logarithms to solve real life problems, including logarithms with different bases, and sketch and interpret logarithmic functions. 2.1.1.LO.4 Formulate and derive appropriate strategies to solve quadratic inequalities. 2.1.1.LO.5 Graph systems of given inequality and identify the region that provides the feasible solution and apply it to real life situations. 2.1.1.LO.6 Determine the set of values for which a rational function is defined and resolve rational functions into partial fractions. 2.1.1.LO.7 Multiply matrices, determine the inverse of a 2 x 2 matrix, find the determinant up to a 3 x 3 matrix and represent matrices in linear transformations.
- Indicator
- 2.1.1.LI.7 - Predict and identify the region representing the solution to systems of linear inequality.
- Suggested placement
-
Semester 1, Week 10
(Week 10 of the year)
Our suggestion, laid out in curriculum order across three terms of twelve weeks. NaCCA does not fix the week, so follow your school's scheme of learning.
- Source document note
-
The official curriculum document has a fault in this entry, so the curriculum text above is transcribed exactly as printed:
- exemplars - p.300: adjacent duplicated CambriaMath characters were collapsed, but this PDF also maps some equation glyphs to the wrong letter or operator; verify every mathematical expression in this row against the rendered page
- Curriculum reference
- NaCCA curriculum document, p. 300
Exemplars (from the NaCCA curriculum)
Collaborative Learning, Experiential Learning, Problem-based Learning, Project-Based Learning and Talk for Learning
Activity: Regions representing solutions of systems of equations and inequalities.
Project-based Learning: Collaborative Learning, Problem-based Learning, Experiential Learning and Talk for Learning Approaches: Learners work together (from whole class discussion to small convenient groups, then in pairs) and explore by analytical methods and then manually (by hand) and using appropriate technology and ICT tools (e.g., GeoGebra), the solutions for systems of linear and quadratic equations and inequalities in two variables identify and state the region that the systems of equations and/or inequalities satisfy.
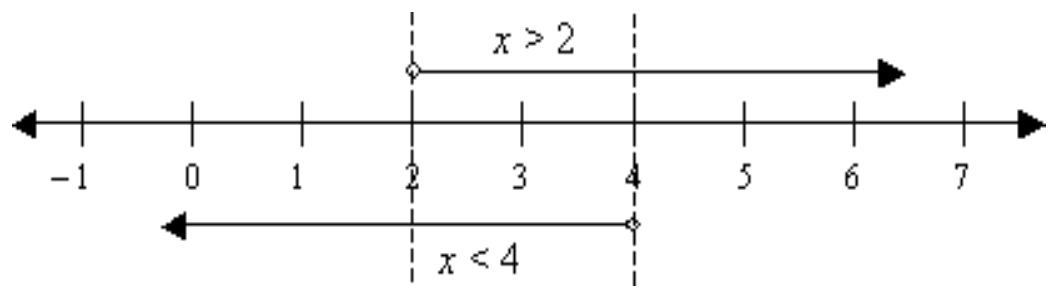
Example Solve 𝑥 + 2 < 6 and 𝑥 - 3 > - 1 using algebraic manipulation and show the region satisfying both inequalities.
Solution 𝑥 + 2 < 6 𝑥 < 6 - 2 𝑥 < 4 Also: 𝑥 - 3 > - 1 ⇔ 𝑥 > - 1 + 3 ⇔ 𝑥 > 2 Common values: 2 < 𝑥 < 4 Graphically, we have:
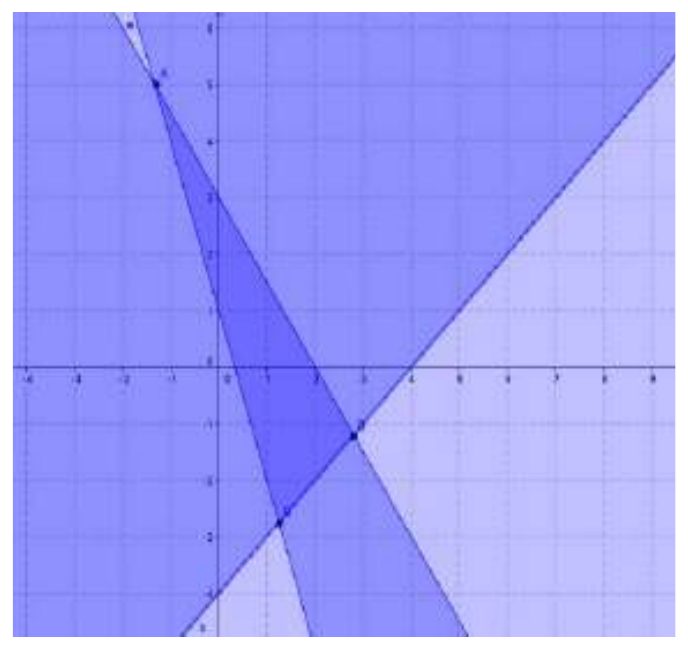
Example Given 3𝑥 + 𝑦 ≥ 1, 𝑥 − 𝑦 < 4 and 3𝑥 + 2𝑦 ≤ 6 , !, !! Show that − ≤ 𝑥 ≤ and − ≤ 𝑦 ≤ 5 " . ,
Solution: , 2(i) + (ii): gives − " ≤ 𝑥; and !, , !, (ii) + 2(iii) gives 𝑥 ≤ . ∴ − " ≤ 𝑥 ≤ .
Also (i) + (ii) gives; 𝑦 ≤ 5; and !! !! (i) + 3(iii) gives; − , ≤ 𝑦; ∴ − , ≤ 𝑦 ≤ 5
 Graphically,
, !, / . !! Hence, the set of points that satisfy the system of inequalities is i− , 5j, i , − j and i , − j " . . , ,
Teaching and Learning Resources:
- Graph paper
- Ruler
- A scientific calculator
Assessment (2.1.1.AS.7). The document marks these depth-of-knowledge levels for this indicator: Level 4 Extended critical thinking and reasoning.