SHS3 Additional Mathematics · Semester 1, Week 18
Measuring Triangles
Full lesson notes coming
Notes for this lesson are being prepared. The curriculum details below are complete and ready to use for your planning.
Curriculum details
- Strand
- Geometric Reasoning and Measurement (Strand 2)
- Sub-strand
- Measuring Triangles (2.2)
- Content standard
- 3.2.2.CS.1 - Demonstrate understanding of graphs of trigonometric functions. 3.2.2.LO.1 Draw and analyse basic trigonometric graphs using values of the unit circle, maximum values and minimum values.
- Indicator
- 3.2.2.LI.1 - Sketch basic trigonometric graphs by hand and/or by technological tools, e.g. GeoGebra and analyse their properties in the unit circle.
- Suggested placement
-
Semester 1, Week 18
(Week 18 of the year)
Our suggestion, laid out in curriculum order across three terms of twelve weeks. NaCCA does not fix the week, so follow your school's scheme of learning.
- Source document note
-
The official curriculum document has a fault in this entry, so the curriculum text above is transcribed exactly as printed:
- exemplars - p.500: adjacent duplicated CambriaMath characters were collapsed, but this PDF also maps some equation glyphs to the wrong letter or operator; verify every mathematical expression in this row against the rendered page
- exemplars - p.501: a stacked fraction, matrix, vector or other two-dimensional construct is flattened by the text layer; all visible parts require comparison with the rendered page
- Curriculum reference
- NaCCA curriculum document, p. 500
Exemplars (from the NaCCA curriculum)
Experiential Learning, Talk for Learning, Group work, and Building on what others say.
Learning Experience: Learners in mixed-ability groups explore properties of trigonometric graphs using GeoGebra.
Activity 1: Learners in groups use GeoGebra to sketch trigonometric graphs
Example 1: Sketch 𝑦 = 𝑠
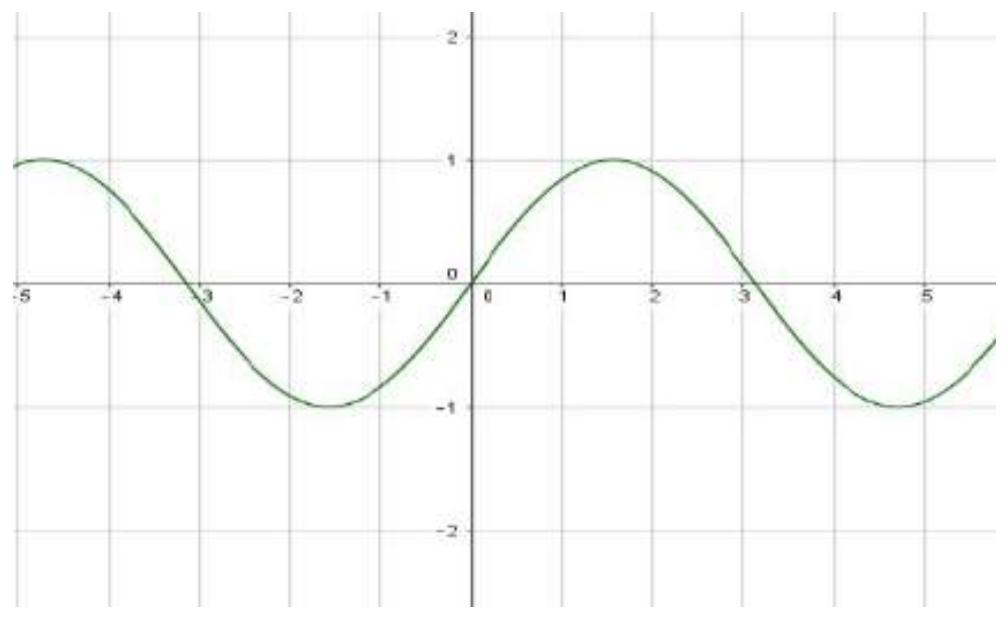
Activity 2: Transformations of graphs of trigonometric function. Learners in groups discuss how the graphs transform as the trigonometric function transforms.
Example 2: Sketch 𝑦 = 2𝑠
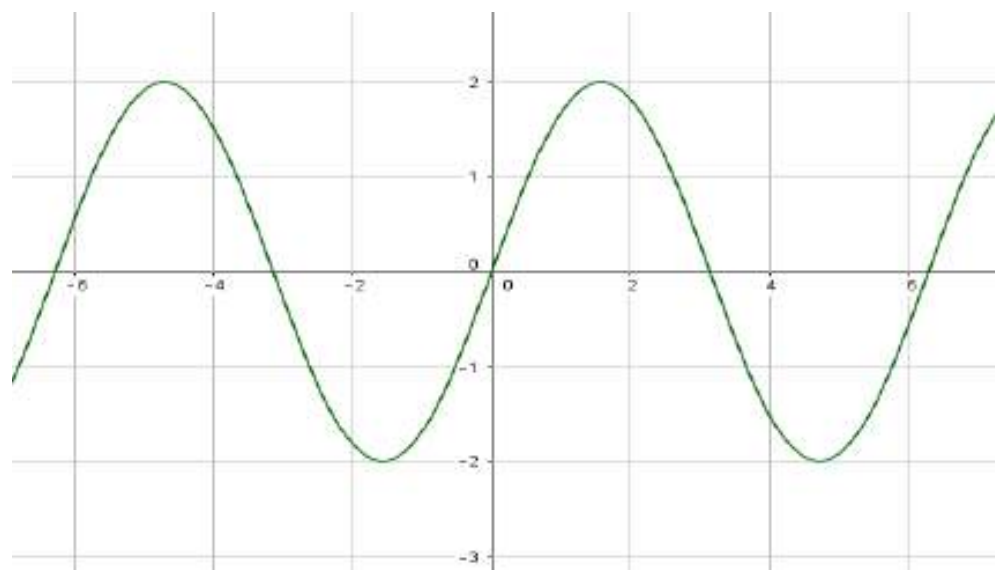
Activity 3: Learners in groups discuss their observations as the graphs transform.
Experiential Learning, Talk for Learning, Group work, and Building on what others say.
Learning Experience: Learners in mixed-ability groups explore sketch trigonometric graphs using the quadrantal angles.
Activity 1: Learners in groups recollect the values of the quadrantal angles for sine and cosine. 𝜃 𝑠 𝑐 0° 0 1 90° 1 0 180° 0 1 270° 1 0 360° 0 1
Activity 2: Learners use these values to sketch trigonometric graphs with a specified interval.
Teaching and Learning Resources:
- Scientific Calculator
Assessment (3.2.2.AS.1). The document marks these depth-of-knowledge levels for this indicator: Level 2 Skills of conceptual understanding; Level 3 Strategic reasoning; Level 4 Extended critical thinking and reasoning.