SHS3 Additional Mathematics · Semester 1, Week 10
Spatial Reasoning
Full lesson notes coming
Notes for this lesson are being prepared. The curriculum details below are complete and ready to use for your planning.
Curriculum details
- Strand
- Geometric Reasoning and Measurement (Strand 2)
- Sub-strand
- Spatial Reasoning (2.1)
- Content standard
- 3.2.1.CS.1 - Demonstrate an understanding of Parabola and its properties. 3.2.1.LO.1 Construct a parabola of a given quadratic equation (𝑦 = 𝑎𝑥 ) + 𝑏 + 𝑐) and explain its key features 3.2.1.LO.2 Sketch a parabola and use it to deduce the relation 𝑦 ) = 4𝑎 3.2.1.LO.3 Sketch a parabola given the directrix Communication: Provide learners the opportunity to engage and and focus. 3.2.1.LO.4 Deduce the equation of the tangent and normal to a parabola
- Indicator
- 3.2.1.LI.3 - Explore and describe the features of a parabola (Focus, directrix, axis of symmetry and vertex) using a technological tool and relate it to real life.
- Suggested placement
-
Semester 1, Week 10
(Week 10 of the year)
Our suggestion, laid out in curriculum order across three terms of twelve weeks. NaCCA does not fix the week, so follow your school's scheme of learning.
- Source document note
-
The official curriculum document has a fault in this entry, so the curriculum text above is transcribed exactly as printed:
- exemplars - p.481: adjacent duplicated CambriaMath characters were collapsed, but this PDF also maps some equation glyphs to the wrong letter or operator; verify every mathematical expression in this row against the rendered page
- Curriculum reference
- NaCCA curriculum document, p. 481
Exemplars (from the NaCCA curriculum)
Talk for Learning, and Group Work.
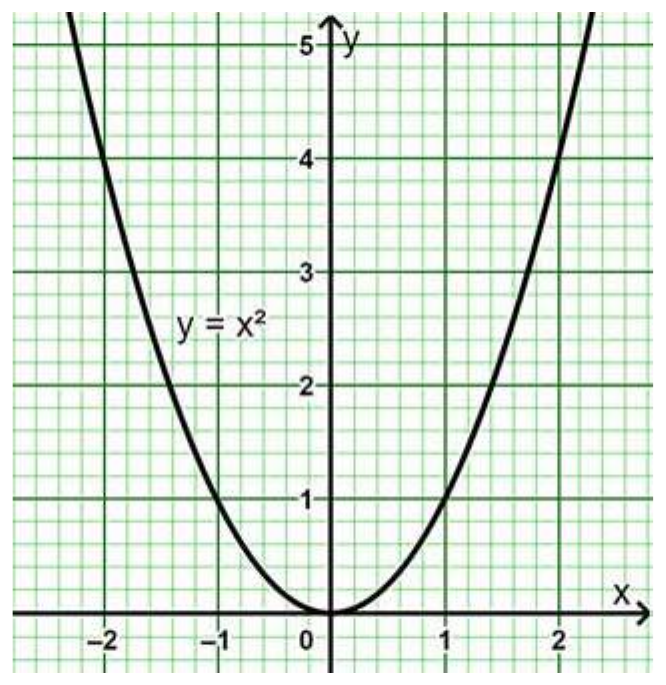
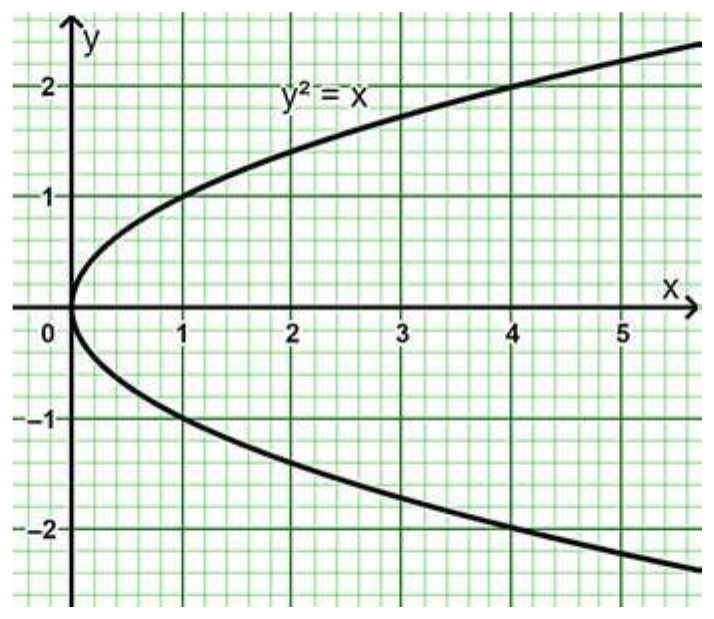
Learning Experience: Learners in groups sketch parabolas in the form 𝑦 = 𝑥 ) and 𝑦 ) = 𝑥
Activity 1: Parabola in the forms 𝑦 = 𝑥 ) and 𝑦 ) = 𝑥 Learners in groups choose an interval to sketch the graph of 𝑦 = 𝑥 ) , 𝑦 ) = 𝑥, 𝑦 = −𝑥 ) and 𝑥 = −𝑦 ) using an ITC tool and by hand and discussing the transformation of the parabolic shapes.
Example 1: Sketch 𝑦 = 𝑥 ) ,
Example 2: Sketch the curve Sketch 𝑦 ) = 𝑥,
Activity 2 Transformation of parabola form 𝑦 = 𝑥 ) and 𝑦 ) = 𝑥 Learners in groups compare and contrast the graphs of 𝑦 = 𝑥 ) and 𝑦 ) = 𝑥 and analyse how the graphs transform when 𝑥 is positive or negative.
Activity 3 Features of parabola graphs Learners in groups brainstorm to describe a parabola using visible properties and discuss some keywords in the parabola.
Expected Response
- A parabola graph has a U-shaped curved.
- The graph has an extreme point called the vertex (turning point of the graph).
- If the parabola opens up, the vertex is the lowest point on the graph or the minimum value of the quadratic function.
- If the parabola opens down, the vertex is the highest point on the graph or the maximum value.
The graph is also symmetric with a vertical line drawn through the vertex, called the axis of symmetry.
Teaching and Learning Resources:
- SHS Curriculum, Graph boards, mathematical set, ICT tools
Assessment (3.2.1.AS.3). The document marks these depth-of-knowledge levels for this indicator: Level 1 Recall.