SHS3 Mathematics · Semester 2, Week 15
Statistical Reasoning and Its Application in Real Life
Full lesson notes coming
Notes for this lesson are being prepared. The curriculum details below are complete and ready to use for your planning.
Curriculum details
- Strand
- Making Sense of and Using Data (Strand 4)
- Sub-strand
- Statistical Reasoning and Its Application in Real Life (4.1)
- Content standard
- 3.4.1.CS.2 - Demonstrate the ability to compare different data sets and use appropriate vocabulary to contribute to mathematical and everyday discussions and make inferences about the information gathered. 3.4.1.LO.2 Compare different datasets and use mathematical vocabulary and language (concretely, pictorially, symbolically, spoken or written, etc.) to contribute to mathematical and everyday discussions using valid and reliable data to explain and justify the information produced from the data.
- Indicator
- 3.4.1.LI.2 - Discuss data information published in local and/or international media platforms (local and international TV stations, newspapers, journals, etc.) by making useful inferences from the data to draw conclusions and/or to explain other phenomena.
- Suggested placement
-
Semester 2, Week 15
(Week 35 of the year)
Our suggestion, laid out in curriculum order across three terms of twelve weeks. NaCCA does not fix the week, so follow your school's scheme of learning.
- Curriculum reference
- NaCCA curriculum document, p. 376
Exemplars (from the NaCCA curriculum)
Group discussions: In small groups, learners discuss data published on a local media platform and draw conclusions with justifications. Encourage tolerance among learners as they work in groups by creating opportunities for Collaborative Learning through mixed-ability grouping within a differentiated mathematics classroom instruction and assessment.
Example: As part of a study to understand the impact and effect of illegal mining (galamsey) towards the socio-economic development of mining communities, a case study was carried out in Kenyasi in the Brong Ahafo Region. The chart below shows the educational background of the respondents interviewed for the study.
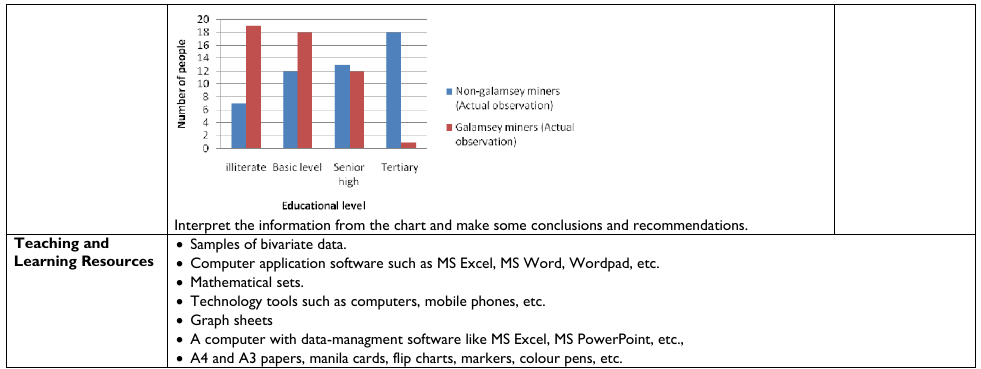
Interpret the information from the chart and make some conclusions and recommendations.
Teaching and Learning Resources:
- * Samples of bivariate data. * Computer application software such as MS Excel, MS Word, Wordpad, etc. * Mathematical sets. * Technology tools such as computers, mobile phones, etc. * Graph sheets * A computer with data-managment software like MS Excel, MS PowerPoint, etc., * A4 and A3 papers, manila cards, flip charts, markers, colour pens, etc.
Assessment (3.4.1.AS.3). The document marks these depth-of-knowledge levels for this indicator: Level 1 Recall; Level 3 Strategic reasoning.