SHS3 Mathematics · Semester 2, Week 12
Statistical Reasoning and Its Application in Real Life
Full lesson notes coming
Notes for this lesson are being prepared. The curriculum details below are complete and ready to use for your planning.
Curriculum details
- Strand
- Making Sense of and Using Data (Strand 4)
- Sub-strand
- Statistical Reasoning and Its Application in Real Life (4.1)
- Content standard
- 3.4.1.CS.1 - Demonstrate understanding of data handling involving simple mathematical relationships of bivariate data in observational and experimental contexts. 3.4.1.LO.1 Establish simple mathematical relationships between two variables in a given observational or experimental context; illustrate using scatter graphs and use them to solve and/or pose problems.
- Indicator
- 3.4.1.LI.2 - Collect data from an experimental study in which the interest is based on treatment and non-treatment (control) groups. Illustrate the data using scatter graphs and find the relationship between the variables, if any.
- Suggested placement
-
Semester 2, Week 12
(Week 32 of the year)
Our suggestion, laid out in curriculum order across three terms of twelve weeks. NaCCA does not fix the week, so follow your school's scheme of learning.
- Source document note
-
The official curriculum document has a fault in this entry, so the curriculum text above is transcribed exactly as printed:
- exemplars - p.372: this exemplar sets a two-dimensional construct - a stacked fraction, an index or a column vector - which the text layer flattens into separate lines, so the parts are present but their vertical arrangement is lost; read the page
- Curriculum reference
- NaCCA curriculum document, p. 371
Exemplars (from the NaCCA curriculum)
Experiential and Project-based Learning: In convenient groups, task learners to interpret data presented in graphs (scatter plots), draw conclusions and give justification for the conclusions.
Example 1: A reading test is given to 10 learners in Basic 6. They then participated in an extensive reading programme. After participating in the programme (group manipulated), they were retested. The data collected was organised and plotted as a scatterplot (the ordered pair of scores for each learner) as follows:
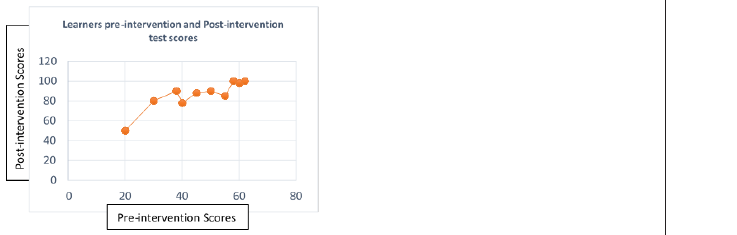
In small groups, study the scatterplot (using the skills for plotting and interpreting points on a graph sheet), find the relationship between Pre-intervention Reading Test Scores and Post-intervention Reading Test Scores, do a comparison, draw a conclusion and justify the conclusion.
Example 2: The blood sugar level of 10 learners is tested before and after an exercise session. The bivariate (i.e., two variables - independent and dependent) data collected are organised and presented in the table below:
Blood Sugar Level Blood Sugar Level before the Exercise after the Exercise Age Sex (mmol/L) (mmol/L) 12 F 9.0 8.1 11 M 8.5 7.5 13 M 10 8.7 12 F 7.2 6.6 12 F 9.5 8.1 11 M 12.0 10.8 13 F 8.0 6.9 12 M 16.0 14.3 14 F 7.5 6.7 11 M 9.0 7.5
i. Do a scatterplot of the bivariate data (you may round off the blood sugar levels to the nearest whole numbers). ii. What is the relationship between the Blood Sugar Level before and after the exercise sessions?
Teaching and Learning Resources:
- * Samples of bivariate data. * Computer application software such as MS Excel, MS Word, Wordpad, etc. * Mathematical sets. * Technology tools such as computers, mobile phones, etc. * Graph sheets * A computer with data-managment software like MS Excel, MS PowerPoint, etc., * A4 and A3 papers, manila cards, flip charts, markers, colour pens, etc.
Assessment (3.4.1.AS.2). The document marks these depth-of-knowledge levels for this indicator: Level 1 Recall; Level 3 Strategic reasoning.