SHS3 Mathematics · Semester 1, Week 10
Patterns and Relations
Full lesson notes coming
Notes for this lesson are being prepared. The curriculum details below are complete and ready to use for your planning.
Curriculum details
- Strand
- Algebraic Reasoning (Strand 2)
- Sub-strand
- Patterns and Relations (2.2)
- Content standard
- 3.2.2.CS.1 - Demonstrate understanding of the concept of quadratic functions and equations and solve real-life problems with them. 3.2.2.LO.1 Solve problems on quadratic functions and equations, including real-life problems.
- Indicator
- 3.2.2.LI.2 - Solve quadratic equations graphically and find the maximum and minimum points of quadratic graphs.
- Suggested placement
-
Semester 1, Week 10
(Week 10 of the year)
Our suggestion, laid out in curriculum order across three terms of twelve weeks. NaCCA does not fix the week, so follow your school's scheme of learning.
- Source document note
-
The official curriculum document has a fault in this entry, so the curriculum text above is transcribed exactly as printed:
- exemplars - p.315: this exemplar sets a two-dimensional construct - a stacked fraction, an index or a column vector - which the text layer flattens into separate lines, so the parts are present but their vertical arrangement is lost; read the page
- Curriculum reference
- NaCCA curriculum document, p. 314
Exemplars (from the NaCCA curriculum)
Using Talk for Learning, Review, through a whole class discussion, learners' knowledge on how to draw graphs of a linear equation, deal with their misconceptions about such concepts, and extend the ideas to draw the graph of quadratic functions.
Experiential Learning: In convenient groups, engage learners to draw and identify the properties of a quadratic graph. Offer positive support when students are having difficulties with self-regulation.
Example: The graph of a quadratic function is a U-shaped curve called a parabola.
It has an extreme point, or a turning point, called the verte. If the parabola opens up, the vertex or the point represents the lowest point on the graph or the minimum value of the quadratic function.
If the parabola opens down, the vertex or the turning point represents the highest point on the graph, or the maximum value.
The graph is also symmetric with a vertical line drawn through the vertex, called the axis of symmetry
Graph of a parabola showing the x and y intercepts, vertex, and axis of symmetry.
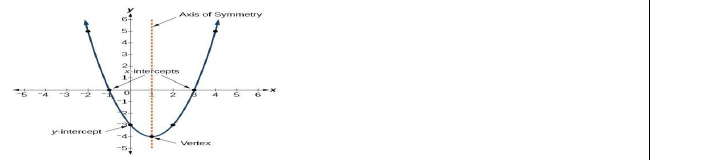
The y-intercept is the point at which the parabola crosses the y-axis. The x-intercepts are the points at which the parabola crosses the x-axis. If they exist, the x-intercepts represent the zeros, or roots, of the quadratic function, the values of x at which y=0.
Think-pair share: Using pair activities, solve quadratic problems using the graphical method.
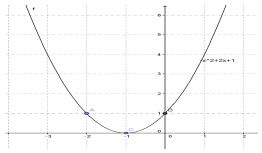
Examples: i. Draw the graph of 𝑦 = 𝑥 2 + 2𝑥 + 1 in an interval −3 ≤ 𝑥 ≤ 1 investigate and justify the effect of the graph if a. The value of 𝑎 changes b. The value of 𝑏 changes c. The value of 𝑐 changes. d. The value of 𝑎 < 0 or negative
Solution: To draw the graph of a quadratic function, make a table with the values of x given to help you find the values of y, which will help you draw the graph of the quadratic functions given. 𝑥 -3 -2 -1 0 1 𝑦 4 1 0 1 4
ii. Make a table of values for the equation 𝑦 = −2𝑥 2 + 4𝑥 + 2 and determine the maximum point, maximum value, and the roots of the parabola.
Solution
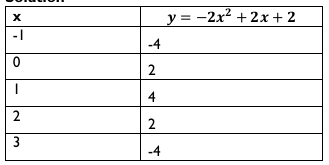
x 𝒚 = −𝟐𝒙 𝟐 + 𝟐𝒙 + 𝟐 -1 -4 0 2 1 4 2 2 3 -4
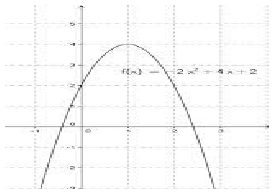
The maximum point is (1,4) The maximum value is 4 The roots are (-1.5, 2.5)
iii. If 𝑦 = 𝑥 2 + 2𝑥 − 3, use the graph below to identify the roots, the y-intercept, and the turning point.
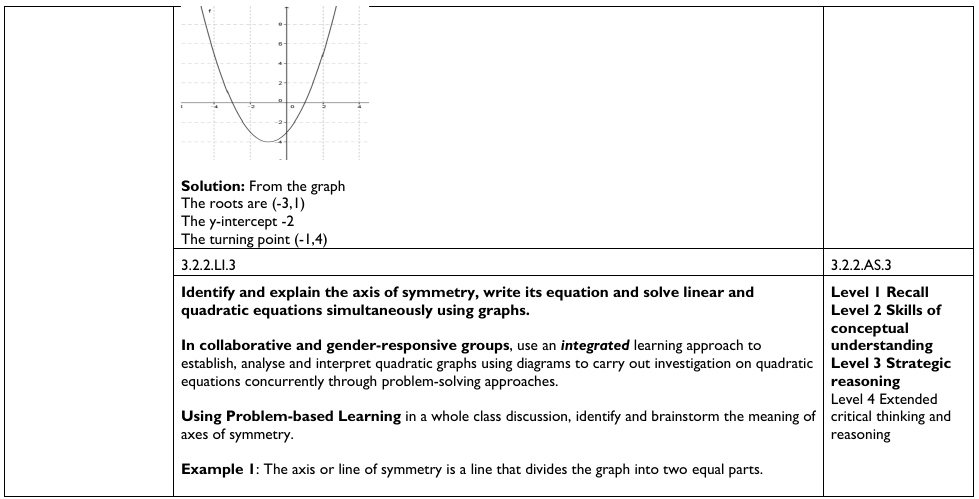
Solution: From the graph The roots are (-3,1) The y-intercept -2 The turning point (-1,4)
Teaching and Learning Resources:
- Teaching and Learning Resources
- Manipulative (dice, coins, spinners, playing cards, counters, digit cards),
- Simple Probability Mazes (Printable & Digital),
- Worksheets
- Task Cards
Assessment (3.2.2.AS.2). The document marks these depth-of-knowledge levels for this indicator: Level 2 Skills of conceptual understanding; Level 3 Strategic reasoning.