SHS2 Mathematics · Semester 1, Week 12
Applications of Expressions, Equations and Inequalities
Lesson notes
Learning Objectives
Indicator: 2.2.1.LI.1 - Solve simultaneous linear equations involving two variables using the graphical method and interpret them.
By the end of the lesson, learners can:
- Rewrite any linear equation in two variables into the slope-intercept form, y = mx + c, stating the gradient (m) and the y-intercept (c).
- Draw the graph of a linear equation using the gradient and the y-intercept.
- Solve a pair of simultaneous linear equations graphically by locating the point of intersection of the two lines.
- Interpret the point of intersection as the single solution that satisfies both equations.
- Verify a graphical solution by substituting the coordinates into both original equations.
Sign in with your phone number to read the full note and download the GES plan - free.
Sign in with phone numberCurriculum details
- Strand
- Algebraic Reasoning (Strand 2)
- Sub-strand
- Applications of Expressions, Equations and Inequalities (2.1)
- Content standard
- 2.2.1.CS.1 - Demonstrate knowledge and understanding of the concept of simultaneous equations involving two variables and apply it to solve every day-life problem. 2.2.1.LO.1 Solve linear equations in two variables using the elimination, substitution and graphical methods. 2.2.1.LO.2 Analyse, model, and solve simultaneous linear equations involving real-life problems.
- Indicator
- 2.2.1.LI.1 - Solve simultaneous linear equations involving two variables using the graphical method and interpret them.
- Suggested placement
-
Semester 1, Week 12
(Week 12 of the year)
Our suggestion, laid out in curriculum order across three terms of twelve weeks. NaCCA does not fix the week, so follow your school's scheme of learning.
- Source document note
-
The official curriculum document has a fault in this entry, so the curriculum text above is transcribed exactly as printed:
- content standard text - p.191: this sub-strand prints 2 learning outcomes (2.2.1.LO.1, 2.2.1.LO.2) against one content standard, which is what its scope-and-sequence row also promises, so 2.2.1.LO.2 has no content standard of its own; it is carried on this row with its competencies rather than dropped
- Curriculum reference
- NaCCA curriculum document, p. 191
Exemplars (from the NaCCA curriculum)
Using group work/Collaborative Learning, review learners' knowledge on linear equations, deal with their misconceptions about such concepts, and extend the ideas to two linear equations using GeoGebra (where available). Bring up scenarios for learners to respond to situations that require empathy and cooperation. Learners should discuss the need to be discipline with the use of technological tools in their learning.
Using Talk for Learning strategy, engage learner in a whole class, to explain simultaneous equation and the solution of simultaneous equations in two variables as one point or value that satisfies both equations. (i.e. the intersection of the two lines) and the strategies for solving them. (I.e., graphical, elimination, and substitution method.) Offer fair and equitable opportunity for all learners including showing tolerance for each one's contributions.
Using Talk for Learning strategy, engage learner in a whole class to discuss and explain the graphical method of solving simultaneous equations using the slop-intercept form. I.e., 𝑦 = 𝑚𝑥 + 𝑐 where 𝑚 is the slope, and 𝑐 is the 𝑦- intercept. Learners should show respect for each other.
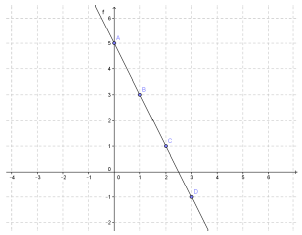
Steps: i. Write the two equations in the slope intercept form. (e.g., the equation, 𝑦 + 2𝑥 = 5 in the slope-intercept form is 𝑦 = −2𝑥 + 5 ii. Use the 𝑦-intercept and the gradient to draw the line 𝑦 = −2𝑥 + 5. I.e.,
In small ability mixed groups find the point or value that satisfies the simultaneous equation using the graphical method . 𝑦 + 𝑥 = 3 𝑦 = 4𝑥 − 2
Solution: Draw the two lines graphically by writing the two equations in the slope intercept form. I.e., 𝑦 = −𝑥 − 3 𝑦 = 4𝑥 − 2
Use the gradient and the y-intercept to draw the two lines.
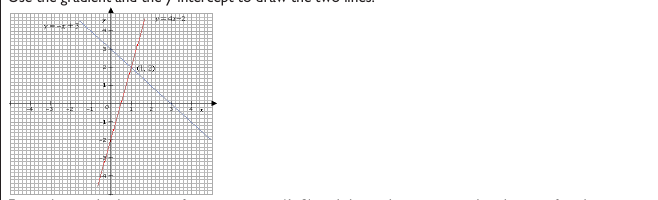
From the graph, the point of intersection is (1, 2) and this is the point or value that satisfies the two equations.
Problem-based Learning: In a small mixed-ability/gender group, draw the lines of the equations below, investigate the patterns in the graph and find the solution that satisfies both equations, and justify your answer. (I.e. x - y = 3 and 𝑥 + 𝑦 = 5.)
Solution: Write the equations in the slope-intercept form. (i.e., 𝑦 = 𝑥 − 3 and 𝑦 = −𝑥 + 5). On the same graph sheet, draw the two lines.
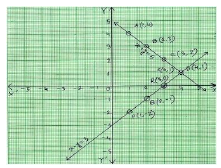
The patterns for the line 𝑦 = 𝑥 − 3 are (-1, -4), (-2,0), (1, -2), (2, -1), (3,0), (4,1), (5,2) and the patterns for the line 𝑦 = −𝑥 + 5 are (0,5), (1,4), (2,3), (4,1), (5,0).
From the patterns of both lines, the point (4,1) is common, and this is the point of intersection that becomes the solution for both equations.
Problem-based Learning: In small mixed-ability/gender groups, task learners to solve direct and indirect questions consisting of simultaneous equations using a graphical method. Encourage learners to respect the diversity among themselves in the classroom, leading to the promotion of respect for divergent views and inclusivity in the mathematics learning environment and beyond.
Teaching and Learning Resources:
- * Geodot * Rubber bands * Computer
- * GeoGebra * Google search * Mobile phone
- * Calculator * YouTube videos, etc. * Geodot,
- * Rubber bands * Cardboards * Measuring instruments
Assessment (2.2.1.AS.1). The document marks these depth-of-knowledge levels for this indicator: Level 1 Recall.